
Page 76 - 2020_07-Haematologica-web
P. 76
X. Fan et al.
We analyzed CFU from two animals at 3.5 months post- transplantation (ZJ31 and JD76). The clone heatmaps from these two monkeys documented that the majority of bar- codes retrieved from pooled CFU-E were also detected in pooled CFU-GM, along with purified monocytes and Gr, suggesting a shared unbiased myeloid-erythroid HSPC pool (Figure 3B). In addition, we observed unique groups of clones contributing to either CFU-E or CFU-GM but not to both, and those unique clones were also detected as low-contributing clones in circulating blood lineages (Figure 3B), suggesting that the apparent lineage restriction may be due to sampling limitations of the pooled CFU approach.
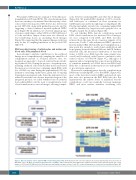
RNA barcoding tracing of reticulocytes and mature red blood cells from peripheral blood
In an attempt to analyze contributions to the erythroid lineage more comprehensively, sampling the entire blood compartment instead of localized marrow sites, we designed an approach to barcode retrieval from circulat- ing erythroid cells. During the process of erythropoiesis, maturing erythroid cells excluded their nuclei and exited the marrow as reticulocytes containing ample RNA, with loss of RNA over time during the approximately 100-day lifespan of circulating erythrocytes, given lack of ongoing transcription in anucleate cells. Since the lentiviral vectors utilized located the barcodes in a transcribed region of the integrated provirus, we asked whether barcode retrieval from cellular RNA could be used to quantitatively study clonal contributions to various lineages, allowing compar-
isons between circulating RBC and other blood lineages (Figure 4A). We purified RBC depleted of >99% of nucle- ated leukocytes as confirmed via flow cytometry for CD45 expression and by morphologic scoring (Figure 4B). Polychromatophilic reticulocytes containing ample RNA could be identified by larger size and a grayish color on Wright’s-stained blood smears (Figure 4B).
To ask whether RNA barcode contributions match DNA clonal contributions for nucleated blood lineages, we first compared both DNA and RNA barcodes retrieved from the same blood or marrow samples of Gr, monocytes, B cells, T cells and marrow NRBC, specifical- ly from animal ZK22 15.5 months post transplantation; a time point late enough to reach clonal equilibration and homogeneity between different BM sites and PB. In these nucleated cells, the fractional contributions of barcoded clones to DNA versus RNA from the same sample were overall well-correlated, with Pearson correlation coeffi- cients (r values) of 0.76±0.04 (Figure 4C), although it is apparent and not surprising that some clones in all lineag- es contribute primarily at a DNA but not an RNA level, likely due to insertions in chromatin at sites inhospitable to pro-viral gene expression.
However, in comparing major barcode contributions in RNA from circulating RBC versus BM NRBC (Figure 4D), most of the barcodes found in NRBC and myeloid sam- ples were also present in the RBC RNA barcodes. But quantitatively the relative levels of individual barcode contributions could vary markedly between immature NRBC and more mature anucleate circulating cells,
AB
Figure 3. Barcode analysis of bone marrow (BM) colony-forming units (CFU). (A) Flowchart for CFU collection and barcode retrieval. (B) Heatmap of top 30 clones in BM CD34+ cells, T, B, Mono, Gr and nucleated red blood cell (NRBC), and pooled myeloid and erythroid CFU samples from ZJ31 (3.5m) and JD76 (3.5m). The colony number of CFU-E and CFU-GM pooled for DNA extraction and analysis are given on top of each CFU column. Heatmaps were constructed as described in Figure 2B.
1818
haematologica | 2020; 105(7)
