
Page 77 - 2020_07-Haematologica-web
P. 77
Erythropoiesis at a clonal level
AB
C
D
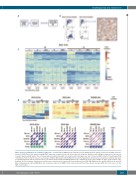
Figure 4. Clonal contributions to circulating erythrocytes. (A) Flowchart for RNA barcode retrieval from circulating anucleate mature red blood cells (RBC) and retic- ulocytes. (B) FACS plots (left panel) showing CD45 expression on whole blood cells before and after leukocyte depletion, and a Wright’s stained blood smear post leukocyte depletion (right panel). The red arrows indicate polychromatophilic reticulocytes with a blue-gray color due to increased RNA content. (C) Heatmap plotting contributions from the top 30 clones in each sample of DNA or RNA obtained from ZK22 15.5m post transplantation, plotted across all samples; heatmap was made as explained in Figure 2B. The paired Pearson correlations between DNA and RNA global barcode contributions to the same sample are given on the bottom of the heatmap. (D) The heatmaps (upper panel) and Pearson correlation plots (lower panel) show peripheral blood (PB) RBC RNA barcodes and the DNA barcode from PB Mono and granulocyte (Gr) and BM Mono, Gr, nucleated red blood cell (NRBC) at the same time point from three rhesus macaque (RM). The color scale is on the right of each panel.
haematologica | 2020; 105(7)
1819
