
Page 75 - 2020_07-Haematologica-web
P. 75
Erythropoiesis at a clonal level
from individual HSPC based on CFU assays.5,6 We conduct- ed barcode analysis on CFU to investigate clonal output in this progenitor population. CD34+ cells were purified from BM samples post transplantation and cultured at low densi- ty under erythroid or myeloid cytokine conditions (Figure
A
B
3A). Individual CFU-E or CFU-GM were plucked and 450- 600 of each type were pooled together for DNA extraction and barcode recovery. Cell populations of NRBC, T cells, B cells, monocytes and Gr were also purified from the remaining CD34- BM cells after CD34+ cell selection.
C
D
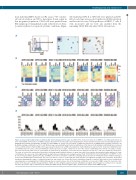
Figure 2. Clonal relationships between erythroid and other hematopoietic lineages. (A) CD45–CD71+ nucleated red blood cell (NRBC) were FACS-purified from six bone marrow (BM) mononuclear cell (MNC) samples obtained from four macaques post transplantation. A representative flow plot and corresponding cytospins of Wright-Giemsa staining and Benzidine staining of purified NRBC are shown. The percentage of NRBC was 94.3±0.8% by Wright-Giemsa staining, and 95.2% by Benzidine staining, counting at least 500 cells. (B) Heat maps representing the log fractional contributions of the top ten most abundant contributing clones retrieved from each different bone marrow (BM) cell lineage population plotted over all BM cell populations. Each individual row represents the fractional contributions from an individual barcode (clone), and each individual column represents a sample. *A barcode is one of the top ten contributing clones in that cell sample (column). Since the top ten barcoded clones in each sample are plotted across all samples, each row in the heat map has at least one*, and each column has exactly ten*. The rows are ordered by unsupervised hierarchical clustering using Euclidean distances to group barcoded clones together that manifest similar patterns of clonal contributions. The color scale on the right depicts the log fractional contribution size. Samples include CD34+ hematopoietic stem and progenitor cell (HSPC), T cells, B cells, monocytes (Mono), granulocytes (Gr), and NRBC. (C) Pearson correlation coefficients comparing all barcoded clonal contributions between different lineages in the same six BM samples shown in (A). The color scale bar for r values is on the right, the shape and the color signify the strength of the correlation. (D) Stacked histograms displaying the degree of erythroid lineage bias and relative size of barcoded clonal contributions (largest to smallest, with smallest clonal contributions appearing only as overlapping lines). Erythroid lineage bias is calculated via a ratio of the fractional contribution of a barcode to NRBC versus the fractional contri- bution of the barcode to another lineage (Gr, Mono, CD34+, T, or B), using the largest fractional contribution among the other lineages for each barcode to calculate the ratio. The positive sign (+) indicates bias towards the NRBC lineage and the negative sign (-) indicates bias away from the NRBC lineage.
haematologica | 2020; 105(7)
1817
