
Page 151 - Haematologica - Vol. 105 n. 6 - June 2020
P. 151
KMT2D mutations and TP53 disruptions in MCL
mutations are a novel, independent, adverse genetic bio- marker in MCL, impacting both on PFS and OS (Figure 2A-B); ii) TP53 disruptions (both mutations and deletion) prospectively confirm their adverse prognostic value in young MCL patients receiving high-dose chemo- immunotherapy followed by ASCT, both in terms of PFS and OS (Figures 2C-D and Figure 3); iii) identification of either KMT2D mutations or TP53 disruption (or both) defines a HR group of young MCL patients whose out- come is still not satisfactory despite intensive immunochemotherapy and ASCT (Figure 4); iv) these bio- markers may be incorporated into a “MIPI-g” model, accounting for three risk classes (Figure 5), that improves the C-statistics discrimination ability on survival, if com- pared to MIPI-c alone.
The adverse prognostic value of TP53 mutations in MCL has been already observed in some retrospective series,13-17 and has been recently confirmed in a combined series from two, ASCT-based, phase 2 trials of the Nordic Lymphoma Group.17 TP53 deletions impacted on both PFS
and OS in the randomized, phase 3 European MCL Network “Younger” trial,16 while these data were not con- firmed by multivariate analysis in the Nordic study, due to the high association with TP53 mutations.17 Our prospec- tive study performed in a similar patient population of young MCL patients demonstrates that the presence of either TP53 mutations or deletions or both associates with poor prognosis. Importantly, although TP53 aberrations associated with elevated Ki-67, higher MIPI-c classes and blastoid morphology, their impact on survival was inde- pendent of these known risk factors. Moreover, TP53 dis- rupted patients show higher levels of MRD positivity after ASCT, as described in the Online Supplementary Table S5. Finally, some previous studies reported also a negative impact of NOTCH1 mutations in univariate analysis,10,17 however in our cohort these mutations were not an inde- pendent predictor of survival, as most of them co-occurred with TP53 mutations.
In the FIL-MCL0208 trial, KMT2D mutations emerged as a novel biomarker heralding chemo-immunotherapy
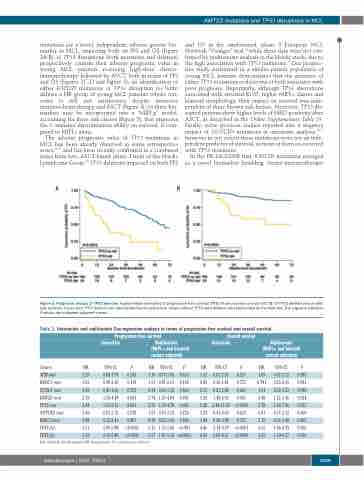
AB
Figure 3. Prognostic impact of TP53 deletion. Kaplan-Meier estimates of progression free survival (PFS) (A) and overall survival (OS) (B) of TP53 deleted versus wild- type patients. Cases with TP53 deletion are represented by the yellow line. Cases without TP53 (del) deletion are represented by the blue line. The Log-rank statistics P-values are indicated adjacent curves.
Table 2. Uniavariate and multivariate Cox-regression analysis in terms of progression free survival and overall survival.
Progression free survival Univariate Multivariate
(MIPI-c and blastoid variant adjusted)
Overall survival Univariate
Multivariate (MIPI-c and blastoid variant adjusted)
Genes
ATM mut WHSC1 mut CCND1 mut KMT2D mut TP53 mut NOTCH1mut BIRC3 mut TP53 del
TP53 dis
HR 95%CI P HR 95%CI P HR 95%CI P HR 95%CI P
1.29 0.84-1.97 0.245 1.19 0.77-1.83 0.432
1.53 0.90-2.60 0.119 1.51 0.87-2.61 0.140
0.83 0.41-1.66 0.595 0.94 0.46-1.92 0.860
2.59 1.50-4.48 0.001 2.74 1.55-4.84 0.001
2.84 1.57-5.13 0.001 2.55 1.36-4.78 0.003
1.86 0.93-3.72 0.078 1.57 0.76-3.24 0.226
0.88 0.32-2.41 0.807 0.70 0.25-1.96 0.500
3.51 2.09-5.88 <0.0001 3.13 1.73-5.68 <0.001 4.46 2.14-9.29 <0.0001 2.65 1.06-6.59 0.036
1.52 0.62-2.51 0.527 1.05 0.52-2.12 0.887 0.85 0.30-2.41 0.755 0.741 0.25-2.15 0.581 0.75 0.23-2.48 0.643 1.01 0.29-3.53 0.980 3.20 1.48-6.92 0.003 2.48 1.12-5.46 0.024 5.28 2.44-11.45 <0.0001 2.78 1.09-7.06 0.032 1.34 0.41-4.40 0.629 0.61 0.17-2.12 0.609 1.84 0.56-6.08 0.315 1.15 0.33-3.98 0.822
3.39 2.10-5.45 <0.0001 3.17 1.87-5.38 <0.0001 4.26 2.09-8.67 <0.0001 2.65 1.10-6.37 0.030
Del: deleted; dis: disrupted; HR: hazard ratio; CI: confidence interval.
haematologica | 2020; 105(6)
1609
