
Page 149 - Haematologica - Vol. 105 n. 6 - June 2020
P. 149
KMT2D mutations and TP53 disruptions in MCL
S2 and Online Supplementary Table S2). Mutated genes were ATM (41.9%), followed by WHSC1 (15.6%), KMT2D (12.4%), CCND1 (11.8%), TP53 (8.1%), NOTCH1 (7.5%), BIRC3 (5.9%) and TRAF2 (1.1%). KMT2D deletion occurred in 1.6% of patients (3 of 190) and TP53 deletion in 13.2% patients (25 of 190). TP53 was inactivated by mutations or deletions in 31 of 186 (16.6%) cases, including 8 of 186 (4.3%) mutated/deleted cases, 16 of 186 (8.6%) deleted but not mutated cases, and 7 of 186 (3.7%) mutated but not deleted cases. KMT2D was inac- tivated by mutations or deletions in 25 of 186 (13.4%) cases, including 1 of 186 (<1%) mutated/deleted case, 2 of 186 (<1%) deleted but non mutated cases, and 22 of 186 (11.8%) mutated but not deleted cases.
KMT2D mutations and TP53 disruption associate with poor outcome in MCL
By univariate analysis, mutations of KMT2D were asso- ciated with poor clinical outcome in terms of both PFS and OS. At 4 years, the PFS of KMT2D mutated patients was 33.2% versus 63.7% (P<0.001) in wild-type (WT) cases (Figure 2A). The OS of KMT2D mutated patients was 62.3% versus 86.8% (P=0.002) in WT patients (Figure 2B). Consistent with previous reports, both TP53 mutations and deletion associated with shorter PFS and OS at 4 years (Figure 2C-D and Figure 3). In detail, the negative prognos- tic impact for TP53 disruption was equal for all the three inactivation modalities, which were then considered as a single group for further analyses (Online Supplementary Figure S3). No further survival analysis was performed on KMT2D deletions, given the low frequency of this genetic lesion. All the other investigated mutations did not show a strong association with PFS or OS (Online Supplementary Figure S4-6 and Online Supplementary Table S3).
Patients harboring TP53 disruption were significantly enriched in known high-risk features of MCL. Indeed, 48.3% of the TP53 disrupted patients had Ki-67 ≥30%, 37.9% scored in the higher MIPI-c risk classes (i.e. “inter- mediate-high” and “high”), and 22.6% showed blastoid
morphology. Conversely, 45.5% of cases harboring KMT2D mutations scored in the higher MIPI-c risk classes but did not associate with Ki-67 expression or blastoid morphology (Online Supplementary Table S4). Moreover, KMT2D mutated patients showed slightly higher beta-2 microglobulin (B2M) median values, as well as higher prevalence of B symptoms and bulky disease (>5 cm) than WT patients (all P<0.05). Interestingly, also TP53 disrupt- ed patients showed slightly higher B2M median values (P<0.05) than WT patients (Online Supplementary Table S4) and were associated with a high rate of disease progres- sion during treatment (9 of 31 patients, 29%). Moreover, TP53 disrupted patients reached lower levels of MRD neg- ativity after ASCT, if compared with WT ones: 35% versus 58% in BM (P=0.06) and 58% versus 80% in PB (P=0.04), respectively. Similar trends were seen for KMT2D mutat- ed patients (46% vs. 55% in BM and 58% vs. 79%), albeit not statistically significant (Online Supplementary Table S5). Analogous to the Nordic Lymphoma Group MCL2 and MCL3 trials,17 also in our study morphological BM involvement was significantly associated with the pres- ence of mutations in any of the genes analysed (P<0.05). However, both TP53 disruptions and KMT2D mutations were equally distributed in patients with and without BM involvement (P=0.26 and P=0.32, respectively).
By multivariate analysis adjusted for the validated risk factors MIPI-c and blastoid variant, both KMT2D muta- tions and TP53 disruptions maintained an independent increased hazard of progression and death (Table 2 and Online Supplementary Table S6). Patients carrying at least one of these genetic lesions, namely KMT2D mutations, TP53 mutations or deletion (n=49/186, 26.3%), had a 4- year PFS of 32.0% versus 69.9% of WT patients (P<0.0001) and a 4-year OS of 65.1% versus 90.3% (P<0.0001), respec- tively (Figure 4).
Integration of a genetic score into the MIPI-c: the “MIPI-g” model
In order to integrate the clinical impact of KMT2D
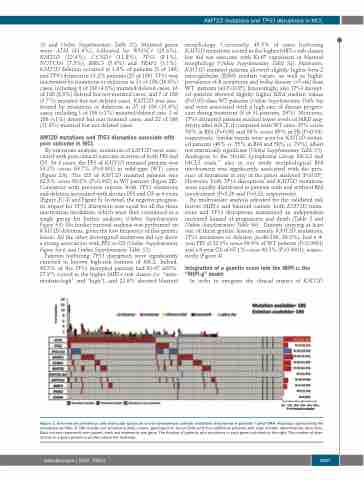
Figure 1. Overview on prevalence and molecular spectrum of non-synonymous somatic mutations discovered in patients’ tumor DNA. Heatmap representing the mutational profiles of 186 mantle cell lymphoma (MCL) cases, genotyped on tumor DNA (and four additional patients with copy number abnormalities data only). Each column represents one patient, each row represents one gene. The fraction of patients with mutations in each gene is plotted on the right. The number of aber- rations in a given patient is plotted above the heatmap.
haematologica | 2020; 105(6)
1607
