
Page 139 - Haematologica - Vol. 105 n. 6 - June 2020
P. 139
Follicular helper T cells in FL
These findings confirm that the majority of GC or follic- ular CD4pos cells that strongly express PD-1 and ICOS are TFH and constitute the same proportion of CD4+ cells in normal and neoplastic follicles.
THH co-localize with proliferating B cells
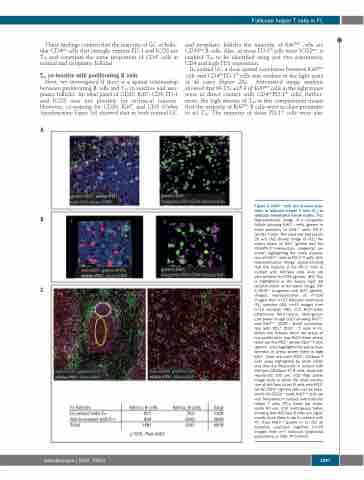
Next, we investigated if there is a spatial relationship between proliferating B cells and TFH in reactive and neo- plastic follicles. An ideal panel of CD20, Ki67, CD4, PD-1 and ICOS was not possible for technical reasons. However, co-staining for CD20, Ki67, and CD3 (Online Supplementary Figure S4) showed that in both normal GC
and neoplastic follicles the majority of Ki67pos cells are CD20pos B cells. Also, as most PD-1Hi cells were ICOSpos, it enabled TFH to be identified using just two parameters; CD4 and high PD1 expression.
In normal GC a close spatial correlation between Ki67pos cells and CD4posPD-1Hi cells was evident in the light zone of all cases (Figure 2A). Automated image analysis showed that 63.1% ±15.9 of Ki67pos cells in the light zones were in direct contact with CD4posPD-1Hi cells, further- more, the high density of TFH in this compartment meant that the majority of Ki67pos B cells were in close proximity to ≥1 TFH. The majority of these PD-1Hi cells were also
A
B
C
Figure 3. Ki67pos cells are in close prox- imity to follicular helper T cells (TFH) in follicular lymphoma lymph nodes. (A1) Representative image of a neoplastic follicle showing Ki67pos cells (green) in close proximity to CD4pos (red), PD-1Hi (white) T cells. The scale bar represents 25 μm. (A2) Binary image of (A1), the binary layers of Ki67 (green) and the CD4-PD-1Hi intersection (magenta) are shown highlighting the close associa- tion of Ki67pos cells to PD-1Hi T cells. (B1) Representative image demonstrating that the majority of the PD-1Hi cells in contact with Ki67pos cells (red) are also positive for ICOS (green). (B2) This is highlighted in the binary layer 3D reconstruction of the same image, PD- 1/ICOSpos (magenta) and Ki67 (green). Images representative of n=100 images from n=23 follicular lymphoma (FL) samples (4A), n=43 images from n=13 samples (4B). (C1) Ki67=blue, CD20=red, PD-1=white, CD3=green. Low power image (x10) showing Ki67pos and Ki67neg CD20pos B-cell co-localisa- tion with PD1Hi CD3pos T cells in FL. Within the follicles there are areas of low proliferation (low Ki67=blue) where there are few PD1Hi (white) CD3pos T cells (green) - area highlighted by yellow oval, whereas in areas where there is high Ki67, there are more PD1Hi, CD3pos T cells (area highlighted by white circle) and they are frequently in contact with Ki67pos CD20pos FL B cells. Scale bar represents 100 μm. (C2) High power image (x60) in which the close correla- tion of Ki67pos (blue) B cells with PD1Hi (white) CD3pos (green) cells can be seen, whilst the CD20pos (red), Ki67neg cells are less frequently in contact with follicular helper T cells (TFH). Scale bar repre- sents 50 μm. (C3) contingency tables showing that Ki67pos B cells are signif- icantly more likely to be in contact with TFH than Ki67neg B-cells in FL (for all samples analyzed together [n=25 images from n=7 follicular lymphoma specimens] χ2 595, P<0.0001).
χ2 595, P≤0.0001
haematologica | 2020; 105(6)
1597
