
Page 138 - Haematologica - Vol. 105 n. 6 - June 2020
P. 138
W. Townsend et al.
ing experiments demonstrated that these cells had a com- posite CD3pos, CD8neg, PD-1pos, ICOSpos, BCL6pos , CXCR5pos, TBETneg phenotype further confirming their identity as TFH (Figure 1D and Online Supplementary Figure S2C). Although CXCR5 has frequently been used to identify TFH by flow cytometry, we found that it was unhelpful in identifying this cellular subset by microscopy since most T cells pres- ent within these structures were CXCR5pos and it therefore did not help to distinguish them from other GC/follicular- ly located cells (Online Supplementary Figure S2C). It was not possible to use CD4 in these experiments as the anti- body is the same species as the BCL6. No BCL6pos cells
were found to be CD8pos therefore the substitution for CD3 was acceptable (Online Supplementary Figure S2D). The intensity of BCL6 staining in TFH was lower than that observed in FL B-cells but higher than in other T cells (Online Supplementary Figure S2B). Although 25.0% (6.028.0) of ICOSpos T cells and 4.0% (1.0-8.0) of PD-1pos T cells within FL follicles were FOXP3pos, only a minority of dual PD-1posICOSpos T cells expressed FOXP3, (Online Supplementary Figure S3). In comparison to FL, very few FOXP3pos T cells were identified within the GC of reactive LN where they were exclusively located outside the GC (Online Supplementary Figure S3B).
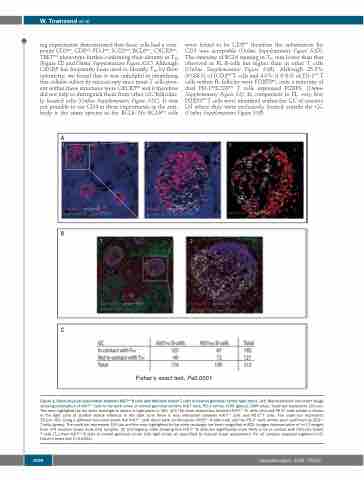
A
B
C
Fisher’s exact test, P≤0.0001
Figure 2. Close physical association between Ki67pos B cells and follicular helper T cells in normal germinal center light zones. (A1) Representative low power image showing polarization of Ki67pos cells to the dark zones of normal germinal centers. Ki67 (red), PD-1 (white), ICOS (green), DAPI (blue). Scale bar represents 100 μm. The area highlighted by the white rectangle is shown in high power in (A2). (A3) The close association between Ki67pos FL cells (red) and PD-1Hi cells (white) is shown in the light zone of another follicle whereas in the dark zone there is less interaction between Ki67pos cells and PD-1Hi T cells. The scale bar represents 25 μm. (B1) Using a different four-color panel, the Ki67pos cells (blue) were confirmed as CD20pos B cells (red) and the PD-1Hi cells (white) were confirmed as CD3pos T cells (green). The scale bar represents 100 μm and the area highlighted by the white rectangle has been magnified in (B2). Images representative of n=13 images from n=4 reactive lymph node (LN) samples. (C) Contingency table showing that Ki67pos B cells are significantly more likely to be in contact with follicular helper T cells (TFH) than Ki67neg B cells in normal germinal center (GC) light zones, as quantified by manual visual assessment. For all samples analyzed together (n=5, Fisher’s exact test P<0.0001).
1596
haematologica | 2020; 105(6)
