
Page 137 - Haematologica - Vol. 105 n. 6 - June 2020
P. 137
Follicular helper T cells in FL
30.7% lower in follicular CD4pos T cells than in their inter- follicular counterparts suggesting that these represent a distinct population of T cells (Online Supplementary Figure S2). Whilst CD4pos PD-1posICOSpos cells were restricted to the follicles, CD4pos PD-1pos ICOSneg cells were present in
A
the interfollicular area where 9.3% (5.1-26.4) of CD4pos cells expressed PD-1. The intensity of PD-1 expression was significantly higher in follicular PD-1pos T cells than interfollicular PD-1pos T cells (Online Supplementary Figure S2) consistent with them being TFH .35 Additional co-stain-
B
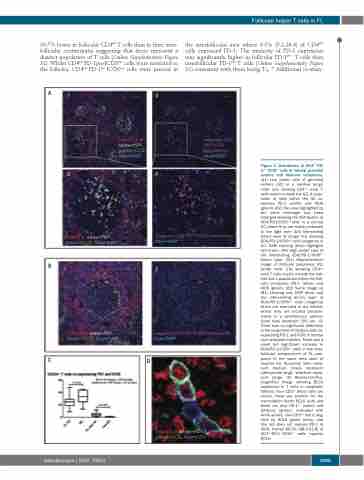
Figure 1. Distribution of CD4pos PD- 1pos ICOSpos cells in normal germinal centers and follicular lymphoma. (A1) Low power view of germinal centers (GC) in a reactive lymph node (LN) showing CD4pos (red) T- cells mainly outside the GC. A popu- lation of cells within the GC co- express PD-1 (white) and ICOS (green). (A2) The area highlighted by the white rectangle has been enlarged showing the distribution of CD4/PD1/ICOSpos cells in a normal GC where they are mainly polarized to the light zone (A3) Intersecting binary layer of image (A1) showing CD4/PD-1/ICOSpos cells (magenta) in GC. DAPI staining (blue) highlights cell nuclei. (A4) High power view of the intersecting CD4/PD-1/ICOSpos binary layer. (B1) Representative image of follicular lymphoma (FL) lymph node (LN) showing CD4pos (red) T cells mainly outside the folli- cles but a population within the folli- cles co-express PD-1 (white) and ICOS (green). (B2) Same image as (B1) showing only DAPI (blue) and the intersecting binary layer of CD4/PD-1/ICOSpos cells (magenta) which are restricted to the follicles where they are located predomi- nantly in a peri-follicular pattern. Scale bars represent 100 μm. (C) There was no significant difference in the proportion of CD4pos cells co- expressing PD-1 and ICOS in normal and neoplastic follicles. There was a small but significant increase in CD4/PD-1/ICOSpos cells in the inter- follicular compartment of FL com- pared to the same area zone of reactive LN. Horizontal lines repre- sent median, boxes represent interquartile range, ‘whiskers’ repre- sent range. (D) Representative, magnified image showing BLC6 expression in T cells in neoplastic follicles. Four CD3pos (blue) cells are shown, three are positive for the transcription factor BCL6 (red) and these are also PD-1pos (white) and ICOSpos (green), indicated with white arrows. One CD3pos cell is neg- ative for BCL6 (green arrow), and this cell does not express PD-1 or ICOS. Overall 89.6% (88.3-91.8) of CD3posPD1posICOSpos cells express BCL6.
CD
P=NS
haematologica | 2020; 105(6)
1595
