
Page 105 - Haematologica - Vol. 105 n. 6 - June 2020
P. 105
Obesity and risk of AML/APL, FLT3 muts and fat metabolism
tries in the last decades (especially in the USA), we obtained data that were as close as possible to the median year of diagnosis (2002 for Italy, 2003 for Spain, 2007 for the USA) (Table 3; see also Methods section).
In all three cohorts, there was strong evidence that the observed BMI distribution for cases across World Health Organization (WHO) BMI classes was different from that expected under the null hypothesis of no association (Italy: P<0.001; Spain: P=0.011; USA: P<0.001) (Table 3) in gender-, age-, and ethnicity- (for USA) matched controls. In particular, in all three datasets, there were more cases than expected in the higher BMI groups, irrespective of gender in all cohorts apart from Spain, in which signifi- cance was not reached for males (P=0.130) despite a simi- lar trend (Table 3).
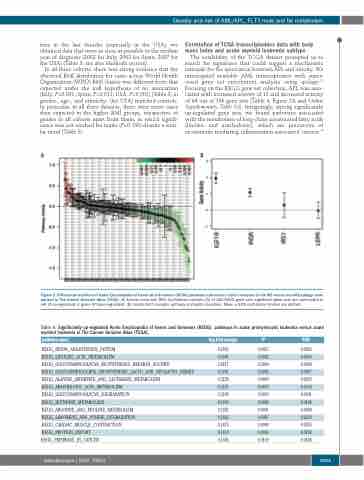
Correlation of TCGA transcriptomics data with body mass index and acute myeloid leukemia subtype
The availability of the TCGA dataset prompted us to search for signatures that could suggest a mechanistic rationale for the association between APL and obesity. We interrogated available AML transcriptomes with super- vised gene set enrichment analysis using quSage.15 Focusing on the KEGG gene set collection, APL was asso- ciated with increased activity of 13 and decreased activity of 64 out of 186 gene sets (Table 4, Figure 2A and Online Supplementary Table S2). Intriguingly, among significantly up-regulated gene sets, we found pathways associated with the metabolism of long-chain unsaturated fatty acids (linoleic and arachidonic), which are precursors of eicosanoids mediating inflammation-associated cancers.18
AB
Figure 2. Differential activities of Kyoto Encyclopedia of Genes and Genomes (KEGG) pathways and insulin/leptin receptors in the M3 versus non-M3 quSage com- parison in The Cancer Genome Atlas (TCGA). (A) Activity score with 95% Confidence Intervals (CI) of 186 KEGG gene sets; significant gene sets are color-coded in red (if up-regulated) or green (if down-regulated). (B) Insulin/IGF1 receptor pathway and leptin receptors. Mean ± 95% confidence interval are plotted.
Table 4. Significantly up-regulated Kyoto Encyclopedia of Genes and Genomes (KEGG) pathways in acute promyelocytic leukemia versus acute myeloid leukemia in The Cancer Genome Atlas (TCGA).
pathway.name
KEGG_RENIN_ANGIOTENSIN_SYSTEM
KEGG_LINOLEIC_ACID_METABOLISM KEGG_GLYCOSAMINOGLYCAN_BIOSYNTHESIS_HEPARAN_SULFATE KEGG_GLYCOSPHINGOLIPID_BIOSYNTHESIS_LACTO_AND_NEOLACTO_SERIES KEGG_ALANINE_ASPARTATE_AND_GLUTAMATE_METABOLISM KEGG_ARACHIDONIC_ACID_METABOLISM KEGG_GLYCOSAMINOGLYCAN_DEGRADATION
KEGG_HISTIDINE_METABOLISM KEGG_ARGININE_AND_PROLINE_METABOLISM KEGG_LIMONENE_AND_PINENE_DEGRADATION KEGG_CARDIAC_MUSCLE_CONTRACTION
KEGG_PROTEIN_EXPORT
KEGG_PATHWAYS_IN_CANCER
log.fold.change P 0.6503 0.0023
0.6381 0.0002 0.4217 0.0000 0.3391 0.0003 0.3258 0.0009 0.3221 0.0037 0.3208 0.0000 0.2996 0.0044 0.2582 0.0001 0.1662 0.0087 0.1475 0.0084 0.1439 0.0066 0.1346 0.0169
FDR
0.0093
0.0010 0.0000 0.0017 0.0039 0.0130 0.0001 0.0148 0.0008 0.0250 0.0245 0.0204 0.0428
haematologica | 2020; 105(6)
1563
