
Page 104 - Haematologica - Vol. 105 n. 6 - June 2020
P. 104
L. Mazzarella et al.
APL (95%CI: 1.0-2.08), 1.17 for non APL-AML (95%CI: 1.10-1.26), 1.04 for LL (95%CI: 1.0-1.09), and 1.10 for other leukemias (95%CI: 1.04-1.15) (Table 1 and Figure 1). Stratification by gender suggested a stronger effect for male gender in APL (HR 1.82, 95%CI: 1.10- 3.00 vs. female HR 1.19, 95%CI: 0.67-1.98), although the sample size becomes very small (n=13 each). Together, these results suggest that higher BMI is associated with increased risk of all sub-types of leukemia, particularly APL.
Cross-sectional studies in Italian, Spanish and US trial cohorts
Though APL showed the strongest association with higher BMI in the cohort analysis described above, results were not conclusive due to the small number of cases identified (n=26) and the consequently wide confidence intervals. To strengthen the evidence, we carried out ret- rospective case-control studies using cohorts of APL
patients from national registries of clinical trials from Spain (PETHEMA) and Italy (GIMEMA), and patients from the US-based AML genome sequencing study (the AML TCGA cohort with 22 additional cases characterized at Washington University, St Louis, MO). In all three groups, APL diagnosis was established using gold standard diagnostic procedures.
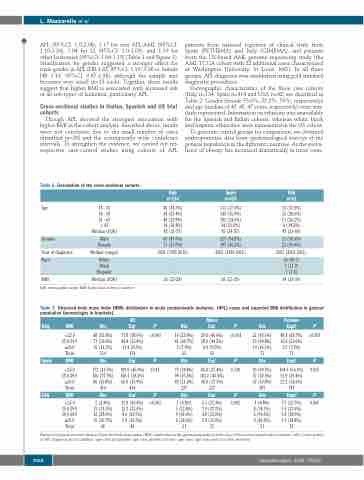
Demographic characteristics of the three case cohorts (Italy n=134, Spain n=414 and USA n=42) are described in Table 2. Gender (female 53.0%, 55.2%, 50%, respectively) and age (median of 45, 45, 47 years, respectively) were sim- ilarly represented. Information on ethnicity was unavailable for the Spanish and Italian cohorts, whereas white, black and hispanic ethnicities were represented in the US cohort.
To generate control groups for comparison, we obtained anthropometric data from epidemiological surveys of the general population in the different countries. As the preva- lence of obesity has increased dramatically in most coun-
Table 2. Description of the cross-sectional cohorts.
Age
Gender
Year of diagnosis
18 - 35 36-50 51-65 >65 Median (IQR)
Male
Female Median (range)
Italy n=134
46 (34.3%) 34 (25.4%) 40 (29.9%) 14 (10.4%) 45 (31-57)
63 (47.0%)
71 (53.0%) 2002 (1997-2010)
Spain n=414
113 (27.3%) 145 (35.0%) 102 (24.6%) 54 (13.0%) 45 (34-57)
227 (54.8%)
187 (45.2%) 2003 (1996-2012)
USA n=42
13 (31.0%) 12 (28.6%) 11 (26.2%) 6 (14.3%) 47 (33-60)
21 (50.0%)
21 (50.0%) 2007 (2001-2011)
Race White - - 36(85.7) Black - - 5(11.9) Hispanic - - 1 (2.4)
BMI Median (IQR) 26 (23-28) 26 (23-29) 34 (28-39)
IQR: interquartile range; BMI: body mass index; n: number.
Table 3. Observed body mass index (BMI) distribution in acute promyelocytic leukemia (APL) cases and expected BMI distribution in general population (percentages in brackets).
Italy
Spain
USA
All BMI Obs Expa
<25.0 48 (35.8%) 77.8 (58.0%) 25.0-29.9 71 (53.0%) 44.8 (33.4%) ≥30.0 15 (11.2%) 11.4 (8.5%)
Total 134 134
BMI Obs Expa
<25.0 172 (41.5%) 189.9 (45.9%) 25.0-29.9 156 (37.7%) 158.1 (38.2%) ≥30.0 86 (20.8%) 66.0 (15.9%)
Total 414 414
BMI Obs Expb
<25.0 2 (4.8%) 12.8 (30.6%) 25.0-29.9 13 (31.0%) 13.7 (32.6%) 30.0-34.9 12 (28.6%) 8.6 (20.5%)
P
<0.001
P
0.011
P
<0.001
Males Obs Expc
16 (25.4%) 29.0 (46.0%) 42 (66.7%) 28.0 (44.5%) 5 (7.9%) 6.0 (9.5%)
63 63
Obs Expc
79 (34.8%) 85.0 (37.4%) 99 (43.6%) 103.2 (45.5%) 49 (21.6%) 38.8 (17.1%)
227 227
Obs Expc
1 (4.8%) 5.3 (25.4%) 5 (23.8%) 7.9 (37.7%) 9 (42.9%) 4.8 (23.0%) 6 (28.6%) 2.9 (13.9%)
P
<0.001
P
0.130
P
0.002
Obs
32 (45.1%) 29 (40.8%) 10 (14.1%) 71
Obs
93 (49.7%) 57 (30.5%) 37 (19.8%) 187
Obs
Females
Expdc P
≥35.0 15 (35.7%) 6.9 (16.3%)
Total 42 42 21 21 21 21
1 (4.8%) 8 (38.1%) 3 (14.3%) 9 (42.9%)
Expdd P
0.003
48.8 (68.7%) 16.8 (23.6%) 5.5 (7.7%) 71
<0.001
Expdc P
104.9 (56.1%) 55.9 (29.4%) 27.2 (14.6%) 187
0.033
7.5 (35.7%) 5.8 (27.6%) 3.8 (18.0%) 3.9 (18.8%)
Expected frequencies were obtained from the body mass index (BMI) distribution in the general population of the area of the acute promyelocytic leukemia (APL) cases,period of APL diagnosis and in addition: aage class and gender; bage class, gender and race; cage class; dage class and race. Obs: observed.
1562
haematologica | 2020; 105(6)
