
Page 106 - Haematologica - Vol. 105 n. 6 - June 2020
P. 106
L. Mazzarella et al.
Also noticeable was the APL-associated upregulation of insulin and insulin-like growth factor (IGF1) receptors, but not leptin receptor (Figure 2B); insulin signaling-associated pathways were also specifically up-regulated in obese ver- sus non-obese APL patients ("type II diabetes mellitus" and "insulin signaling") (Online Supplementary Table S2).
No pathway was significantly enriched in obese versus non-obese patients among non-M3 cases.
Correlation of mutational data with body mass index
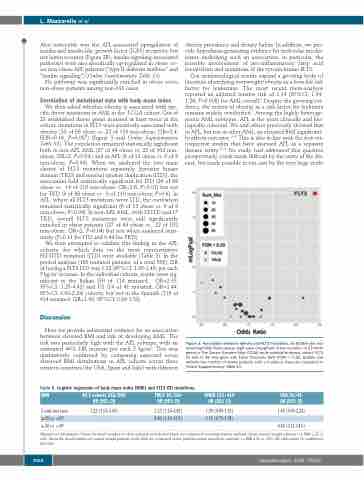
We then asked whether obesity is associated with spe- cific driver mutations in AML in the TCGA cohort. Out of 23 established driver genes mutated at least twice in the cohort, mutations in FLT3 were positively associated with obesity (33 of 88 obese vs. 22 of 110 non-obese; OR=2.4, FDR=0.16, P=0.007) (Figure 3 and Online Supplementary Table S3). The correlation remained statistically significant both in non-APL AML (27 of 49 obese vs. 22 of 102 non- obese; OR=2, P=0.04,) and in APL (6 of 12 obese vs. 0 of 8 non-obese; P=0.04). When we analyzed the two main classes of FLT3 mutations separately [tyrosine kinase domain (TKD) and internal tandem duplication (ITD)], the association held statistically significant for ITD (24 of 88 obese vs. 14 of 110 non-obese; OR=2.6, P=0.01) but not for TKD (9 of 88 obese vs. 8 of 110 non-obese; P=0.6). In APL, where all FLT3 mutations were ITD, the correlation remained statistically significant (6 of 12 obese vs. 0 of 8 non-obese; P=0.04). In non-APL AML, with 32 ITD and 17 TKD, overall FLT3 mutations were still significantly enriched in obese patients ((27 of 49 obese vs. 22 of 102 non-obese; OR=2, P=0.04) but not when analyzed sepa- rately (P=0.11 for ITD and 0.44 for TKD).
We then attempted to validate this finding in the APL cohorts, for which data on the most representative FLT3ITD mutation (ITD) were available (Table 5). In the pooled analysis (163 mutated patients, of a total 569), OR of having a FLT3 ITD was 1.22 (95%CI: 1.05-1.43) per each 5 kg/m2 increase. In the individual cohorts, results were sig- nificant in the Italian (30 of 114 mutated, OR=2.35, 95%CI: 1.25-4.42) and US (14 of 41 mutated, OR=1.44, 95%CI: 0.93-2.24) cohorts, but not in the Spanish (119 of 414 mutated, OR=1.09, 95%CI: 0.89-1.33).
Discussion
Here we provide substantial evidence for an association between elevated BMI and risk of developing AML. The risk was particularly high with the APL subtype, with an estimated 44% HR increase per each 5 kg/m2. This was qualitatively confirmed by comparing expected versus observed BMI distributions in APL cohorts across three western countries (the USA, Spain and Italy) with different
obesity prevalence and dietary habits. In addition, we pro- vide hypothesis-generating evidence for molecular mecha- nisms underlying such an association, in particular, the possible involvement of pro-inflammatory fatty acid metabolism and mutations of the tyrosin kinase FLT3.
Our epidemiological results expand a growing body of literature identifying overweight/obesity as a bona fide risk factor for leukemias. The most recent meta-analysis reported an adjusted relative risk of 1.14 (95%CI: 1.04- 1.26; P=0.008) for AML overall.5 Despite the growing evi- dence, the notion of obesity as a risk factor for leukemia remains widely overlooked.7 Among the highly heteroge- neous AML subtypes, APL is the most clinically and bio- logically coherent. We and others previously showed that in APL, but not in other AML, an elevated BMI significant- ly affects outcome.10,19 This is also in line with the few ret- rospective studies that have assessed APL as a separate disease entity.20,21 No study had addressed this question prospectively, a task made difficult by the rarity of the dis- ease, but made possible in our case by the very large study
BMI
5 unit increase
≥ 25 vs. <25b ≥ 30 vs. <30b
All 3 cohorts 163/569a OR (95% CI)
1.22 (1.05-1.43)
-
-
ITALY 30/114a OR (95% CI)
2.35 (1.25-4.42)
4.40 (1.63-11.9)
-
SPAIN 119/414a OR (95% CI)
1.09 (0.89-1.33)
1.15 (0.75-1.78)
-
USA 14/41a OR (95% CI)
1.44 (0.93-2.24)
-
6.46 (1.21-34.5)
Figure 3. Association between obesity and FLT3 mutations. (A) Bubble plot rep- resenting Odds Ratio versus -logP value (mLogPval) of any mutation in 23 driver genes in The Cancer Genome Atlas (TCGA) acute myeloid leukemia cohort. FLT3 (in red) is the only gene with False Discovery Rate (FDR) < 0.25. Bubble size reflects the number of obese patients with a mutation. Data are tabulated in Online Supplementary Table S3.
Table 5. Logistic regression of body mass index (BMI) and FLT3 ITD mutations.
aMutations / All patients. bGiven the small number of obese patients in Italy and Spain, we compared overweight/obese patients versus normal weight patients (i.e. BMI ≥ 25 vs. <25). Given the small number of normal weight patients in the USA, we compared obese patients versus non-obese patients (i.e. BMI ≥ 30 vs. <30). OR: odds ratios; CI: confidence intervals.
1564
haematologica | 2020; 105(6)
