
Page 103 - Haematologica - Vol. 105 n. 6 - June 2020
P. 103
Obesity and risk of AML/APL, FLT3 muts and fat metabolism
down-loaded from IntOgen.17 For each gene, different mutations were conflated so that gene status in each patient was either "mutated" or "wild-type". For each gene, we then calculated the number of mutated or wild-type patients in the obese or non- obese groups, and calculated odds ratios (OR), 95% confidence intervals (CI), and P-values by Fisher's test with Benjamini- Hochberg correction. Only genes with >1 mutation in the dataset were considered, using the fdsm package in R.
For the analysis of the retrospective cohort, FLT3 Internal Tandem Duplication (ITD) mutational data were provided by the referring centers. Logistic regression was used to calculate OR with 95%CI.
Further details of the methods used are provided in the Online Supplementary Appendix.
Results
Population-based cohort study in the UK
Overall characteristics of the 5.24 million UK adults included in this study have been described previously.6 A total of 5,833 subjects with a diagnosis of “leukemia” over the observational time were included in the present analy-
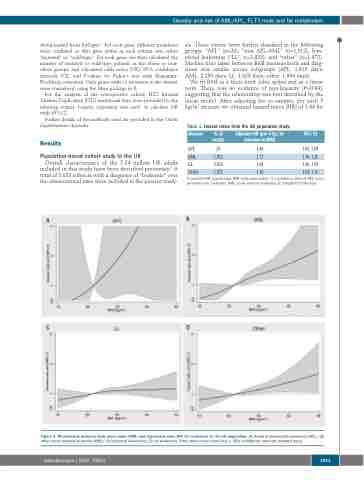
sis. These events were further classified in the following groups: “APL” (n=26), “non APL-AML” (n=1,012), lym- phoid leukemias (“LL”; n=2,823), and “other” (n=1,972). Median time lapse between BMI measurement and diag- nosis was similar across subgroups (APL: 1,810 days; AML: 2,280 days; LL: 1,928 days; other: 1,894 days).
We fit BMI as a three-knot cubic spline and as a linear term. There was no evidence of non-linearity (P=0.94), suggesting that the relationship was best described by the linear model. After adjusting for co-variates, per each 5 kg/m2 increase we obtained hazard ratios (HR) of 1.44 for
Table 1. Hazard ratios from the UK population study.
Disease
APL
AML
LL
Other
N. of events
26
1,012
2,823
1,972
Adjusted HR (per 5 kg/m2 increase in BMI)
1.44
1.17
1.04
1.10
95% CI
1.00, 2.08
1.10, 1.26
1.00, 1.09
1.04, 1.15
A
N: number; HR: hazard ratio; BMI: body mass index; CI: confidence interval; APL: acute promyelocytic leukemia; AML: acute myeloid leukemia; LL: lymphoid leukemias.
B
CD
Figure 1. Relationship between body mass index (BMI) and log-hazard ratio (HR) for leukemias in the UK population. (A) Acute promyelocytic leukemia (APL); (B) other acute myeloid leukemia (AML); (C) lymphoid leukemias; (D) all leukemias. Plots show mean (dark line) ± 95% confidence intervals (shaded area).
haematologica | 2020; 105(6)
1561
