
Page 237 - Haematologica May 2020
P. 237
IL6R-STAT3-ADAR1(P150) interplay in 1q21(amp) MM
A
C
BD
EG
F
H
IJ
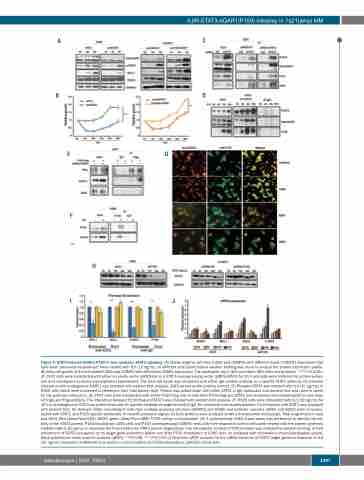
Figure 4. STAT3-induced-ADAR1-P150 in turn mediates STAT3 signaling. (A) Stable isogenic cell lines (U266 and OCIMY5) with different levels of ADAR1 expression that have been previously established24 were treated with IL6 (10 ng/mL) at different time points before western blotting was done to analyze the protein expression profile. (B) Daily cell growth of IL6-stimulated-U266 and OCIMY5 with differential ADAR1 expression. The reading for day 0 (D0) was taken 48 h after manipulation. ***P<0.0001. (C) 293T cells were transfected with either an empty vector (pIRES-EV) or a STAT3-overexpressing vector (pIRES-STAT3) for 24 h and cells were collected for protein extrac- tion and subsequent co-immunoprecipitation experiments. The total cell lysate was incubated with either IgG control antibody or a specific STAT3 antibody. Its potential interaction with endogenous ADAR1 was checked with western blot analysis. JAK2 served as the positive control. (D) Phospho-STAT3 was induced with IL6 (10 ng/mL) in H929 cells which were harvested to determine their total protein level. Protein was pulled down with either STAT3 or IgG antibodies and western blot was used to check for the potential interaction. (E) 293T cells were transfected with either P150-Flag only or with both P150-Flag and STAT3 and reciprocal immunoprecipitation was done with IgG and Flag-antibody. The interaction between P150-Flag and STAT3 was checked with western blot analysis. (F) H929 cells were stimulated with IL6 (10 ng/mL) for 16 h and endogenous P150 was pulled down with its specific antibody or negative control IgG, for reciprocal immunoprecipitation. Its interaction with STAT3 was assessed with western blot. (G) Cytospin slides consisting of cells from multiple myeloma cell lines (OCIMY5 and H929) and patients’ samples (N291 and N292) were immunos- tained with STAT3- and P150-specific antibodies. Immunofluoresence signals for both proteins were analyzed under a fluorescence microscope. Total magnification used was 400x. Red (Alexa-Fluor-555): STAT3; green (Alexa-Flour-488): P150; yellow: co-localization. (H) A cycloheximide (CHX) chase assay was performed to identify the sta- bility of the STAT3 protein. P150-knockdown U266 cells and P150-overexpressing OCIMY5 cells with their respective control cells were treated with the protein synthesis inhibitor CHX at 50 μg/mL to elucidate the time kinetics for STAT3 protein degradation. The intracellular content of STAT3 protein was analyzed by western blotting. (I) Fold enrichment of STAT3 occupancy on its target gene promoters before and after P150 knockdown in U266 cells, as analyzed with chromatin immunoprecipitation quanti- tative polymerase chain reaction analysis (qPCR). **P<0.05, ***P<0.001 (J) Reat-time qPCR analysis for the mRNA induction of STAT3 target genes in response to IL6 (10 ng/mL) treatment at different time points in control (shCtr) and P150-knockdown (shP150) U266 cells.
haematologica | 2020; 105(5)
1397
