
Page 184 - Haematologica May 2020
P. 184
J. Record et al.
cells had reduced capacity to form aggregates and this was associated with low expression of CD11a.
HL0 cells display increased proliferation and genomic instability
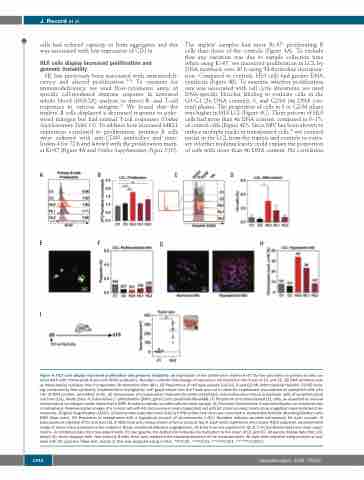
HL has previously been associated with immunodefi- ciency and altered proliferation.25,26 To examine for immunodeficiency, we used flow-cytometric assay of specific cell-mediated immune response in activated whole blood (FASCIA) analysis to detect B- and T-cell responses to various antigens.27 We found that the triplets’ B cells displayed a decreased response to poke- weed mitogen but had normal T-cell responses (Online Supplementary Table S1). To address how increased MKL1 expression correlated to proliferation, primary B cells were cultured with anti-CD40 antibodies and inter- leukin-4 for 72 h and labeled with the proliferation mark- er Ki-67 (Figure 4A and Online Supplementary Figure S5D).
The triplets’ samples had more Ki-67+ proliferating B cells than those of the controls (Figure 4A). To exclude that any variation was due to sample collection time when using Ki-67, we measured proliferation in LCL by DNA synthesis over 20 h using 3H-thymidine incorpora- tion. Compared to controls, HL0 cells had greater DNA synthesis (Figure 4B). To examine whether proliferation rate was associated with cell cycle alterations, we used DNA-specific Hoechst labeling to evaluate cells in the G0/G1 (2n DNA content), S, and G2/M (4n DNA con- tent) phases. The proportion of cells in S or G2/M phase was higher in HL0 LCL (Figure 4C). Three percent of HL0 cells had more than 4n DNA content, compared to 0–1% of control cells (Figure 4D). Since EBV has been shown to induce multiple nuclei in transformed cells,28 we counted nuclei in the LCL from the triplets and controls to evalu- ate whether multinuclearity could explain the proportion of cells with more than 4n DNA content. No correlation
ABCD
EFGH
I
Figure 4. HL0 cells display increased proliferation and genomic instability. (A) Expression of the proliferation marker Ki-67 by flow cytometry on primary B cells cul- tured 48 h with interleukinIL-4 and anti-CD40 antibodies. Numbers indicate fold-change of expression normalized to the mean of C1 and C2. (B) DNA synthesis rate as measured by radiation from incorporated 3H-thymidine after 48 h. (C) Proportions of cell cycle phases (G0/G1, S and G2/M) determined by Hoechst 33342 stain- ing, measured by flow cytometry (representative histograms). Left graph shows how the Y-axis was cut to allow for emphasized visualization of hyperploid cells with >4n of DNA content, quantified in (D). (E) Comparison of mononuclear (indicated by white arrowhead) and multinuclear (black arrowhead) cells of lymphoblastoid cell lines (LCL). White color: 4',6-diamidino-2- phenylindole (DAPI); green color: phalloidin-Alexa488. (F) Proportion of multinucleated LCL cells, as assessed by manual microscopical counting of nuclei stained with DAPI. Numbers indicate counted cells for each sample. (G) Telomere-fluorescence in situ hybridization on chromosomes in metaphase. Representative images of a normal cell with 46 chromosomes and a hyperploid cell with 92 chromosomes; insets show magnified representative chro- mosomes. Original magnification x1000. Chromosomes hybridized with TelG-Cy3 PNA probe (red color) and mounted in Vectashield Antifade Mounting Medium with DAPI (blue color). (H) Proportion of metaphases with a hyperploid amount of chromosomes (>46). Numbers indicate counted metaphases for each sample. (I) Subcutaneous injection of C1 and HL0 LCL in NSG mice and measurement of tumor mass at day 9. Each circle represents one mouse. Right subpanel: representative image of tumor mass assessed at the endpoint. Black arrowhead indicates angiogenesis. (A) Data from one experiment. (B, D, F, H) Combined data from three exper- iments. (I) Combined data from two experiments. For bar graphs, the dotted line indicates normalization to the mean of C1 and C2. All panels display data from LCL except (A), which displays data from primary B cells. Error bars represent the standard deviation of the measurements. All data were analyzed using analysis of vari- ance with the post-hoc Tukey test, except (I) that was analyzed using a t-test. *P<0.05, **P<0.01, ***P<0.001, ****P<0.0001.
1344
haematologica | 2020; 105(5)
