
Page 186 - Haematologica May 2020
P. 186
J. Record et al.
A
BC
D
FG
H
E
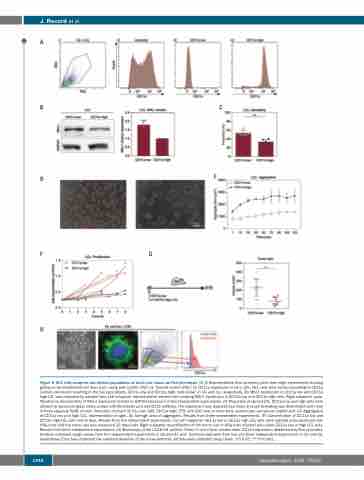
Figure 5. HL1 cells comprise two distinct populations of which one shows an HL0 phenotype. (A) (i) Representative flow cytometry plots from eight experiments showing gating on lymphoblastoid cell lines (LCL) using side scatter (SSC) vs. forward scatter (FSC). (ii) CD11a expression in HL1 cells. HL1 cells were sorted according to CD11a surface expression resulting in the two populations, CD11a low and CD11a high, cells shown in (iii) and (iv), respectively. (B) MKL1 expression in CD11a low and CD11a high LCL was evaluated by western blot. Left subpanel: representative western blot showing MKL1 expression in CD11a low and CD11a high cells. Right subpanel: quan- tification by densitometry of MKL1 expression relative to GAPDH expression in four independent experiments. (C) Proportion of spread LCL. CD11a low and high cells were allowed to spread on glass slides coated with fibronectin and anti-CD19 antibody. The experiment was repeated two times and cell spreading was determined each time in three separate fields of view. Total cells counted: CD11a low: 689; CD11a high: 579; and 200 cells or more were counted per sample per experiment. (D) Aggregation of CD11a low and high LCL, representative images. (E) Average area of aggregates. Results from three independent experiments. (F) Concentration of CD11a low and CD11a high LCL cells over 8 days. Results from five independent experiments. (G) Left subpanel: CD11a low or CD11a high LCL cells were injected subcutaneously into NSG mice and the tumor size was measured 15 days later. Right subpanel: quantification of the tumor size in NSG mice injected with either CD11a low or high LCL cells. Results from three independent experiments. (H) Microscopy of the L1236 HL cell line. Green: F-actin; blue: nuclear stain. CD11a expression determined by flow cytometry. Symbols represent single values from four independent experiments in (B) and (F), and technical replicates from two and three independent experiments in (C) and (G), respectively. Error bars represent the standard deviation of the measurements. All data were analyzed using t-tests. *P<0.05, ***P<0.001.
1346
haematologica | 2020; 105(5)
