
Page 187 - Haematologica May 2020
P. 187
Intronic deletion in MKL1 alters B-cell function
Since the deletion in MKL1 is intronic, we did not antic- ipate any changes in the amino acid sequence and found that the MKL1 expressed was of normal size. The first intron is often essential for the regulation of gene expres- sion,37,38 which is why we investigated possible alterations of MKL1 expression in the triplets’ cells and found that
A
those from the undiagnosed triplet (HL0) displayed the highest expression of MKL1 while cells from HL1 and HL2, the triplets who were successfully treated for HL, showed an intermediate phenotype. This suggests a phe- notypic difference between the triplets based on the onset and treatment of the disease. MKL1, via its interac-
BCDE
FG
HI
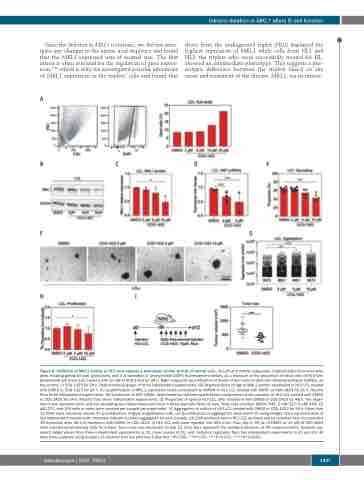
Figure 6. Inhibition of MKL1 activity in HL0 cells induces a phenotype similar to that of control cells. (A) Left and middle subpanels: representative flow cytometry plots showing gating for size, granularity, and 4',6-diamidino-2- phenylindole (DAPI) fluorescence intensity as a measure of the proportion of dead cells of HL0 lym- phoblastoid cell lines (LCL) treated with 10 mM of CCG-1423 for 24 h. Right subpanel: quantification of death of HL0 cells treated with dimethylsulfoxide (DMSO), as the control, or CCG-1423 for 24 h. Representative graph of three independent experiments. (B) Representative image of MKL1 protein expression in HL0 LCL treated with DMSO or CCG-1423 for 24 h. (C) Quantification of MKL1 expression levels normalized to GAPDH in HL0 LCL treated with DMSO or CCG-1423 for 24 h. Results from three independent experiments. (D) Expression of SRF mRNA, determined by real-time quantification polymerase chain reaction, in HL0 LCL treated with DMSO or CCG-1423 for 24 h. Results from three independent experiments. (E) Proportion of spread HL0 LCL after treatment with DMSO or CCG-1423 for 48 h. The exper- iment was repeated twice and cell spreading was determined each time in three separate fields of view. Total cells counted: DMSO: 541; 2 mM: 517; 5 mM: 454; 10 mM: 271; and 100 cells or more were counted per sample per experiment. (F) Aggregation in culture of HL0 LCL treated with DMSO or CCG-1423 for 24 h. More than 15 fields were randomly chosen for quantification. Original magnification x40. (G) Quantification of aggregation observed in (F) using ImageJ. Data representative of two independent experiments. Numbers indicate counted aggregates for each sample. (H) DNA synthesis rate in HL0 LCL as measured by radiation from incorporated 3H-thymidine after 48 h of treatment with DMSO or CCG-1423. (I) HL0 LCL cells were injected into NSG mice. From day 6, 50 mL of DMSO or 10 mM of CCG-1423 were injected intratumorally daily for 6 days. Tumor size was measured on day 12. Error bars represent the standard deviation of the measurements. Symbols rep- resent single values from three independent experiments in (C), mean values in (D), and technical replicates from two independent experiments in (C) and (G). All data were analyzed using analysis of variance with the post-hoc Tukey test. *P<0.05, **P<0.01, ***P<0.001, ****P<0.0001.
haematologica | 2020; 105(5)
1347
