
Page 182 - Haematologica May 2020
P. 182
J. Record et al.
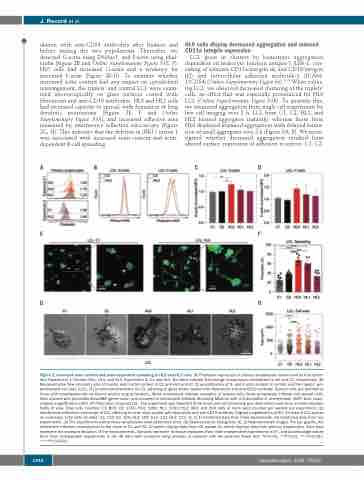
ulation with anti-CD54 antibodies after fixation and before mixing the two populations. Thereafter, we detected G-actin using DNAse1, and F-actin using phal- loidin (Figure 2B and Online Supplementary Figure S1E, F). HL0 cells had increased G-actin and a tendency for increased F-actin (Figure 2B-D). To examine whether increased actin content had any impact on cytoskeletal rearrangement, the triplets’ and control LCL were exam- ined microscopically on glass surfaces coated with fibronectin and anti-CD19 antibodies. HL0 and HL1 cells had increased capacity to spread, with formation of long dendritic protrusions (Figure 2E, F and Online Supplementary Figure S5A), and increased adhesive area measured by interference reflection microscopy (Figure 2G, H). This indicates that the deletion in MKL1 intron 1 was associated with increased actin content and actin- dependent B-cell spreading.
HL0 cells display decreased aggregation and reduced CD11a integrin expression
LCL grow in clusters by homotypic aggregation dependent on leukocyte function antigen-1 (LFA-1, con- sisting of subunits CD11a/integrin αL and CD18/integrin β2) and intercellular adhesion molecule-1 (ICAM- 1/CD54) (Online Supplementary Figure S6).22-24 When cultur- ing LCL, we observed decreased clustering of the triplets’ cells, an effect that was especially pronounced for HL0 LCL (Online Supplementary Figure S5B). To quantify this, we measured aggregation from single cell suspensions by live cell imaging over 2 h. LCL from C1, C2, HL1, and HL2 formed aggregates instantly, whereas those from HL0 displayed impaired aggregation with delayed forma- tion of small aggregates over 2 h (Figure 3A, B). We inves- tigated whether decreased aggregation resulted from altered surface expression of adhesion receptors. C1, C2,
ABCD
EF
GH
Figure 2. Increased actin content and actin-dependent spreading in HL0 and HL1 cells. (A) Phalloidin expression in primary lymphocytes determined by flow cytom- etry. Experiment 1: Control (Ctrl), HL0, and HL1. Experiment 2: C1 and HL2. Numbers indicate fold-change in expression normalized to ctrl and C1, respectively. (B) Representative flow cytometry plot of G-actin and F-actin content in C2 and HL0 and (C, D) quantification of G- and F-actin content in control and the triplets’ lym- phoblastoid cell lines (LCL). (E) Immunocytochemistry of LCL adhering to glass slides coated with fibronectin and anti-CD19 antibody. Spread cells are defined as those with lamellipodia-like structures and/or long protrusions. White arrowheads indicate examples of spread cells; black arrowheads indicate non-spread cells. Cells stained with phalloidin-Alexa488 (green color) and mounted in Vectashield Antifade Mounting Medium with 4',6-diamidino-2- phenylindole (DAPI, blue color). Original magnification x400. (F) Proportion of spread LCL. The experiment was repeated three times and cell spreading was determined each time in three separate fields of view. Total cells counted: C1: 800; C2: 1356; HL0: 1081; HL1: 1062; HL2: 983; and 200 cells or more were counted per sample per experiment. (G) Interference reflection microscopy of LCL adhering to cover slips coated with fibronectin and anti-CD19 antibody. Original magnification x630. (H) Area of LCL spread on coverslips. Total cells counted: C1: 119; C2: 109; HL0: 109; HL1: 131; HL2: 123. (C, D, F) Combined data from three experiments. (H) Combined data from two experiments. (A) The experiments with primary lymphocytes were performed once. (B) Representative histograms. (E, G) Representative images. For bar graphs, the dotted line indicates normalization to the mean of C1 and C2. All panels display data from LCL except (A), which displays data from primary lymphocytes. Error bars represent the standard deviation of the measurements. Symbols represent technical replicates from three independent experiments in (F), and pooled single values from three independent experiments in (H). All data were analyzed using analysis of variance with the post-hoc Tukey test. *P<0.05, **P<0.01, ***P<0.001, ****P<0.0001.
1342
haematologica | 2020; 105(5)
