
Page 181 - Haematologica May 2020
P. 181
Intronic deletion in MKL1 alters B-cell function
AB
CDEF
G
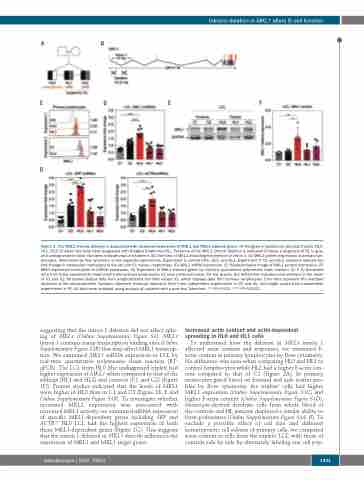
Figure 1. The MKL1 intronic deletion is associated with increased expression of MKL1 and MKL1-induced genes. (A) Pedigree of genetically identical triplets (HL0, HL1, HL2) of whom two have been diagnosed with Hodgkin lymphoma (HL). Presence of the MKL1 intronic deletion is indicated in black, a diagnosis of HL in gray, and undiagnosed in white. Numbers indicate year of treatment. (B) Overview of MKL1 indicating the deletion in intron 1. (C) MKL1 protein expression in primary lym- phocytes, determined by flow cytometry, in two separate experiments. Experiment 1: control (Ctrl), HL0, and HL1. Experiment 2: C1 and HL2. Numbers indicate the fold-change in expression normalized to the ctrl and C1 values, respectively. (D) MKL1 mRNA expression. (E) Representative image of MKL1 protein expression. (F) MKl1 expression normalized to GAPDH expression. (G) Expression of MKL1-induced genes by real-time quantitative polymerase chain reaction. (D, F, G) Combined data from three experiments; experiments with primary lymphocytes (C) were performed once. For bar graphs, the dotted line indicates normalization to the mean of C1 and C2. All panels display data from lymphoblastoid cell lines except (C), which displays data from primary lymphocytes. Error bars represent the standard deviation of the measurements. Symbols represent technical replicates from three independent experiments in (D) and (G), and single values from independent experiments in (F). All data were analyzed using analysis of variance with a post-hoc Tukey test. ***P<0.001, ****P<0.0001.
suggesting that the intron 1 deletion did not affect splic- ing of MKL1 (Online Supplementary Figure S3). MKL1 intron 1 contains many transcription binding sites (Online Supplementary Figure S2B) that may affect MKL1 transcrip- tion. We examined MKL1 mRNA expression in LCL by real-time quantitative polymerase chain reaction (RT- qPCR). The LCL from HL0 (the undiagnosed triplet) had higher expression of MKL1 when compared to that of the siblings (HL1 and HL2) and controls (C1 and C2) (Figure 1D). Protein studies indicated that the levels of MKL1 were higher in HL0 than in C1 and C2 (Figure 1E, F and Online Supplementary Figure S1B). To investigate whether increased MKL1 expression was associated with increased MKL1 activity, we examined mRNA expression of specific MKL1-dependent genes including SRF and ACTB.19 HL0 LCL had the highest expression of both these MKL1-dependent genes (Figure 1G). This suggests that the intron 1 deletion in MKL1 directly influences the expression of MKL1 and MKL1 target genes.
Increased actin content and actin-dependent spreading in HL0 and HL1 cells
To understand how the deletion in MKL1 intron 1 affected actin content and responses, we examined F- actin content in primary lymphocytes by flow cytometry. No difference was seen when comparing HL0 and HL1 to control lymphocytes while HL2 had a higher F-actin con- tent compared to that of C1 (Figure 2A). In primary monocytes gated based on forward and side scatter pro- files by flow cytometry, the triplets’ cells had higher MKL1 expression (Online Supplementary Figure S1C) and higher F-actin content (Online Supplementary Figure S1D). Monocyte-derived dendritic cells from whole blood of the controls and HL patients displayed a similar ability to form podosomes (Online Supplementary Figure S4A, B). To exclude a possible effect of cell size and different hematopoietic cell subsets of primary cells, we compared actin content in cells from the triplets’ LCL with those of controls side by side by alternately labeling one cell pop-
haematologica | 2020; 105(5)
1341
