
Page 173 - Haematologica May 2020
P. 173
Ph– ALL cytogenetics and allogeneic HCT outcomes
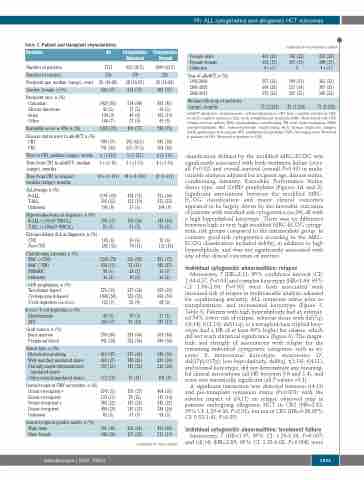
Table 2. Patient and transplant characteristics.
continued from previous column
Variables
Number of patients
Number of centers
Recipient age, median (range), years Gender, female, n (%)
Recipient race, n (%) Caucasian African-American Asian
Disease status prior to alloHCT, n (%) CR1
CR2
Time to CR1, median (range), weeks
Time from CR1 to alloHCT1, median (range), months
Time from CR1 to relapse2,
median (range), months
ALL lineage, n (%) B-ALL
T-ALL
Unknown
Hyperleukocytosis at diagnosis, n (%) B-ALL (>30x109 WBC/L)
T-ALL (>100x109 WBC/L)
Extramedullary ALL at diagnosis, n (%) CNS
Non-CNS
Conditioning intensity, n (%) MAC (+TBI)
MAC (-TBI)
NMA/RIC
Unknown
GvHD prophylaxis, n (%) Tacrolimus-based Cyclosporine A-based T-cell depletion (ex-vivo)
In-vivo T-cell depletion, n (%) Alemtuzumab
ATG
Graft source, n (%) Bone marrow Peripheral blood
Donor type, n (%) HLA-identical sibling Well-matched unrelated donor Partially-matched/mismatched
unrelated donor
Other related/unrelated donor
All
1731
256
29 (16-68) 636 (37)
1429 (83) 42 (2) 154 (9) 106 (7)
1245 (72)
990 (57) 741 (43)
6 (1-123) 3 (<1-16)
20 (<1-111)
1197 (69) 393 (23) 141 (8)
299 (17)
81 (5)
105 (6) 202 (12)
1343 (78) 254 (15) 98 (6) 36 (2)
576 (33) 1000 (58) 123 (7)
46 (3)
286 (17)
790 (46) 941 (54)
819 (47) 469 (27) 357 (21)
172 (10)
574 (33) 193 (11) 385 (22) 494 (29) 85 (5)
691 (40) 340 (20)
Cytogenetics Abnormal
632 (36.5)
178
28 (16-65) 234 (37)
534 (84) 12 (2) 49 (8) 37 (6)
459 (73)
395 (62.5) 237 (37.5)
5 (2-123) 3 (<1-13)
18 (<1-103)
474 (75) 121 (19) 37 (6)
150 (24)
31 (5)
35 (6) 70 (11)
522 (83) 72 (11) 28 (5) 10 (2)
217 (34) 350 (55) 55 (9)
19 (3)
99 (16)
281 (44) 352 (46)
270 (43) 188 (30) 141 (22)
70 (11)
170 (27) 78 (12) 143 (23) 210 (33) 31 (5)
256 (41) 127 (20)
Cytogenetics Normal
1099 (63.5)
226
29 (16-68) 402 (37)
895 (81) 30 (3) 105 (10) 69 (6)
786 (72)
595 (54) 504 (46)
6 (1-113) 4 (<1-16)
21 (1-111)
723 (66) 272 (25) 104 (9)
149 (14)
50 (4)
70 (6) 132 (12)
821 (75) 182 (17) 70 (7) 26 (2)
359 (33) 650 (59) 68 (6)
27 (2)
187 (17)
509 (46) 590 (54)
549 (50) 281 (26) 216 (20)
102 (9)
404 (37) 115 (10) 242 (22) 284 (26) 54 (5)
435 (40) 213 (19)
Female-male Female-female Unknown
Year of alloHCT, n (%) 1995-2000
2001-2005
2006-2011
Median follow up of survivors
(range), months
401 (23) 295 (17)
142 (22)
107 (17)
259 (24) 188 (17) 4 (<1)
363 (33) 387 (35) 349 (32)
73 (2-218)
4(<1) 0
557 (32) 604 (35) 570 (33)
75 (2-224)
194 (31) 217 (34) 221 (35)
87 (3-224)
Other
alloHCT: allogeneic hematopoietic cell transplantation; CR1: first complete remission; CR2: second complete remission; ALL: acute lymphoblastic leukemia; WBC: white blood cell; CNS: central nervous system; MAC: myeloablative conditioning; TBI: total body irradiation; NMA: non-myeloablative; RIC: reduced-intensity conditioning; HLA: human leukocyte antigen; GvHD:graft-versus-host disease;ATG:antithymocyte globulin;CMV:cytomegalovirus.1Referred to patients in CR1. 2Referred to patients in CR2.
classification defined by the modified MRC-ECOG was significantly associated with both treatment failure (over- all P=0.02) and overall survival (overall P=0.03) in multi- variable analyses adjusted for recipient age, disease status, conditioning intensity, Karnofsky Performance Status, donor type, and GvHD prophylaxis (Figures 1A and 2). Significant associations between the modified MRC- ECOG classification and major clinical outcomes appeared to be largely driven by the favorable outcomes of patients with standard-risk cytogenetics (n=24), all with a high hyperdiploid karyotype. There was no difference between high or very high modified MRC-ECOG cytoge- netic risk groups compared to the intermediate group. In contrast, good-risk cytogenetics according to the MRC- ECOG classification included del(9p), in addition to high hyperdiploidy, and was not significantly associated with any of the clinical outcomes of interest.
Individual cytogenetic abnormalities: relapse
Monosomy 7 [HR=2.11; 95% confidence interval (CI): 1.04-4.27, P=0.04] and complex karyotype (HR=1.69; 95% CI: 1.06-2.69, P=0.03) were both associated with increased risk of relapse in multivariable analysis adjusted for conditioning intensity, ALL remission status prior to transplantation, and monosomal karyotype (Figure 3, Table 3). Patients with high hyperdiploidy had an estimat- ed 54% lower risk of relapse, whereas those with del(7q), t(8;14), t(11;19), del(11q), or a tetraploid/near triploid kary- otype had a HR of at least 40% higher for relapse, which did not reach statistical significance (Figure 3). The magni- tude and strength of associations with relapse for the remaining individual cytogenetic categories, such as tri- somy 8, monosomal karyotype, monosomy 17, del(17p)/i(17p), low hypodiploidy, del(6q), t(1;19), t(4;11), and normal karyotype, did not demonstrate any meaning- ful clinical associations (all HR between 0.6 and 1.4), and none was statistically significant (all P-values >0.1).
A significant interaction was detected between t(4;11) and pre-transplant remission status (P<0.001) with the adverse impact of t(4;11) on relapse observed only in patients undergoing allogeneic HCT in CR2 (HR=2.82; 95% CI: 1.25-6.36, P=0.01), but not in CR1 (HR=0.86,95% CI: 0.53-1.41, P=0.55).
Individual cytogenetic abnormalities: treatment failure
Monosomy 7 (HR=1.97; 95% CI: 1.20-3.24, P=0.007) and t(8;14) (HR=2.85; 95% CI: 1.35-6.02, P=0.006) were
Karnofsky score ≥ 90%, n (%)
Donor/recipient CMV serostatus, n (%) Donor+/recipient+ Donor+/recipient-
Donor-/recipient+
Donor-/recipient- Unknown
Donor/recipient gender match, n (%) Male-male
Male-female
continued in next column
haematologica | 2020; 105(5)
1333
