
Page 174 - Haematologica May 2020
P. 174
A. Lazaryan et al.
prognostic for treatment failure after adjustments for recipient age, pre-transplant remission status, condition- ing intensity, donor type, and GvHD prophylaxis in mul- tivariable analyses (Table 4). Trends toward increased risk of treatment failure were observed for patients with del(7q) (HR=2.16; 95% CI: 0.95-4.90, P=0.06) and del(17p)/i(17q) (HR=1.95; 95% CI: 0.80-4.75, P=0.1). In contrast, patients with high hyperdiploidy (HR=0.62; 95% CI: 0.37-1.04, P=0.07) and monosomal karyotype (HR=0.73; 95% CI: 0.54-1.01, P=0.05) trended toward less risk of treatment failure. Although t(4;11) was not associ- ated with treatment failure (HR=1.12; 95% CI: 0.85-1.48, P=0.41) within the entire cohort or in CR1 patients (n=83) (HR=0.98; 95% CI: 0.72-1.33, P=0.89), it was associated with a significantly higher risk of treatment failure in CR2 patients (n=11) (HR=2.35; 95% CI: 1.25-4.43, P=0.008).
Individual cytogenetic abnormalities: overall mortality
After adjustment for recipient age (HR=1.55; 95% CI: 1.17-2.06, P<0.01 for age >55 years versus <40 years),
A
Karnofsky Performance Status <90 (HR=1.29; 95% CI: 1.12-1.48, P<0.001), ALL in CR2 (HR=1.56; 95% CI: 1.36- 1.77, P<0.001), myeloablative conditioning without total body irradiation (HR=1.35; 95% CI: 1.13-1.62, P<0.001), mismatched unrelated donor (HR=1.49; 95% CI: 1.27- 1.76, P<0.001), and GvHD prophylaxis (HR=1.41; 95% CI: 1.11-1.79, P=0.005 for non-calcineurin inhibitor- versus tacrolimus-based) in multivariable analysis, only t(8;14) was associated with higher mortality after allogeneic HCT (HR=3.03; 95% CI: 1.44-6.41, P=0.004).
Novel allogeneic hematopoietic cell transplantation- specific cytogenetic classification
Based on the relapse model adjusted for significant clin- ical factors and individual cytogenetic abnormalities (Figure 3), the following cytogenetic markers with HR≥1.4 were categorized as adverse risk (n=125): mono- somy 7, complex karyotype, del(7q), t(8;14), t(11;19), del(11q), and tetraploid/near triploid karyotype. Conversely, high hyperdiploidy (n=29) was identified as
B
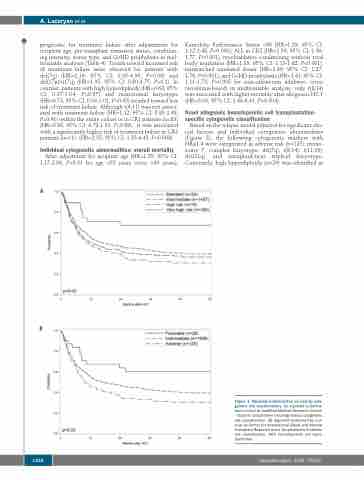
Figure 1. Adjusted leukemia-free survival by cyto- genetic risk classifications. (A) Adjusted leukemia- free survival by modified Medical Research Council – Eastern Cooperative Oncology Group cytogenetic risk classification. (B) Adjusted leukemia-free sur- vival by Center for International Blood and Marrow Transplant Research acute lymphoblastic leukemia risk classification. HCT: hematopoietic cell trans- plantation.
1334
haematologica | 2020; 105(5)
