
Page 78 - Haematologica April 2020
P. 78
L.A. Hampton O’Neil et al.
each peptide treatment (Figure 3D and E). Although +Dex macrophages do not express VCAM1, we also tested whether other integrin interactions contribute to the macrophage-erythroblast relationship in addition to EPHB4. An inhibitory peptide designed against VLA-4, EIL
peptide, was introduced in the formation assay.37 This peptide was generated from a fragment of fibronectin which binds and locks the integrin β1 into the active form. The presence of the VLA-4 inhibitor in the formation assay led to a loss in mean duration (75% of cells have
AB
CD
EF
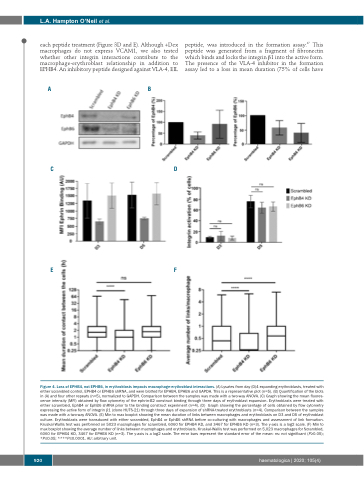
Figure 4. Loss of EPHB4, not EPHB6, in erythroblasts impacts macrophage-erythroblast interactions. (A) Lysates from day (D)4 expanding erythroblasts, treated with either scrambled control, EPHB4 or EPHB6 shRNA, and were blotted for EPHB4, EPHB6 and GAPDH. This is a representative plot (n=5). (B) Quantification of the blots in (A) and four other repeats (n=5), normalized to GAPDH. Comparison between the samples was made with a two-way ANOVA. (C) Graph showing the mean fluores- cence intensity (MFI) obtained by flow cytometry of the ephrin-B2 construct binding through three days of erythroblast expansion. Erythroblasts were treated with either scrambled, EphB4 or EphB6 shRNA prior to the binding construct experiment (n=4). (D) Graph showing the percentage of cells obtained by flow cytometry expressing the active form of integrin β1 (clone HUTS-21) through three days of expansion of shRNA-treated erythroblasts (n=4). Comparison between the samples was made with a two-way ANOVA. (E) Min to max boxplot showing the mean duration of links between macrophages and erythroblasts on D3 and D5 of erythroblast culture. Erythroblasts were transduced with either scrambled, EphB4 or EphB6 shRNA before co-culturing with macrophages and assessment of link formation. Kruskal-Wallis test was performed on 5023 macrophages for scrambled, 6060 for EPHB4 KD, and 3467 for EPHB6 KD (n=3). The y-axis is a log2 scale. (F) Min to max boxplot showing the average number of links between macrophages and erythroblasts. Kruskal-Wallis test was performed on 5,023 macrophages for Scrambled, 6060 for EPHB4 KD, 3467 for EPHB6 KD (n=3). The y-axis is a log2 scale. The error bars represent the standard error of the mean: ns: not significant (P≥0.05); *P≤0.05; ****P≤0.0001. AU: arbitrary unit.
920
haematologica | 2020; 105(4)
