
Page 79 - Haematologica April 2020
P. 79
AB
C
EPHB4 drives macrophage-erythroblasts interactions
contacts which last less than 1h compared to 75% which last more) and an average number of links in +Dex cells (Figure 3B and C).
EPHB4 depletion using shRNA impacts macrophage-erythroblast interaction
To assess the specific importance of EPH receptor expression and rule out secondary binding of the inhibito- ry peptides, EPHB4 and EPHB6 were depleted individually using lentiviral shRNA transduction of early erythroblasts. When EPHB4 is silenced, we observed that there is a con- comitant loss of EPHB6 (Figure 4A). This was not a recip-
rocal relationship, as EPHB6 depletion did not reduce the level of EPHB4 expression, as can be observed in Figure 4B. Heterodimerization of EPHB6 with EPHB4 may, there- fore, be important for its stability on the erythroblast sur- face but not vice versa.38 This occurred in the presence of two different shRNA for each protein (data not shown). Importantly, depletion of EPHB4 reduced ephrin-B2 bind- ing in a surface binding assay but not when EPHB6 alone was knocked down, suggesting that EPHB4 is responsible for the majority of ephrin-B2 binding (Figure 4C). As was seen with the inhibitors, the depletion of the EPHB recep- tors did not lead to a reduction in integrin β1 activation
DE
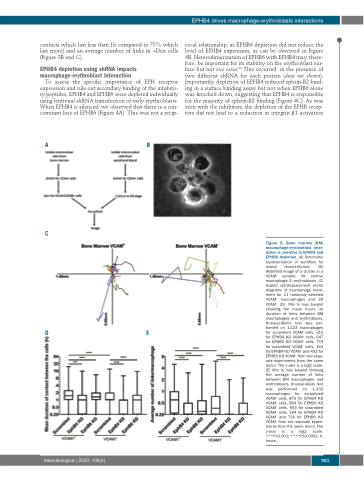
Figure 5. Bone marrow (BM) macrophage-erythroblast inter- action is sensitive to EPHB4 and EPHB6 depletion. (A) Schematic representation of workflow for island reconstitution. (B) Widefield image of a cluster in a VCAM+ sample. M: central macrophage; E: erythroblasts. (C) Scaled cell-displacement vector diagrams of macrophage move- ment for 11 randomly selected VCAM+ macrophages and 20 VCAM–. (D) Min to max boxplot showing the mean hours (h) duration of links between BM macrophages and erythroblasts. Kruskal-Wallis test was per- formed on 1,123 macrophages for scrambled VCAM+ cells, 615 for EPHB4 KD VCAM+ cells, 647 for EPHB6 KD VCAM+ cells, 779 for scrambled VCAM– cells, 164 for EPHB4 KD VCAM– and 432 for EPHB6 KD VCAM– from two sepa- rate experiments from the same donor. The y-axis is a log2 scale. (E) Min to max boxplot showing the average number of links between BM macrophages and erythroblasts. Kruskal-Wallis test was performed on 1,332 macrophages for scrambled VCAM+ cells, 875 for EPHB4 KD VCAM+ cells, 854 for EPHB6 KD VCAM+ cells, 963 for scrambled VCAM– cells, 164 for EPHB4 KD VCAM– and 714 for EPHB6 KD VCAM– from two separate experi- ments from the same donor. The y-axis is a log2 scale. ***P≤0.001; ****P≤0.0001. h: hours.
haematologica | 2020; 105(4)
921
