
Page 76 - Haematologica April 2020
P. 76
L.A. Hampton O’Neil et al.
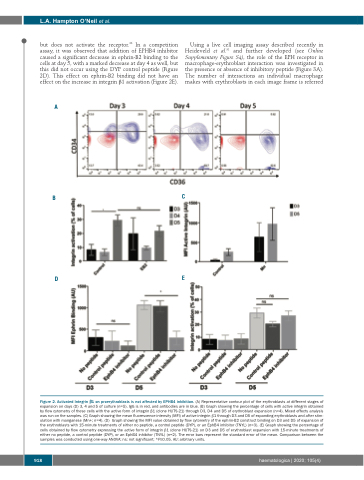
but does not activate the receptor.36 In a competition assay, it was observed that addition of EPHB4 inhibitor caused a significant decrease in ephrin-B2 binding to the cells at day 5, with a marked decrease at day 4 as well, but this did not occur using the DYP control peptide (Figure 2D). This effect on ephrin-B2 binding did not have an effect on the increase in integrin β1 activation (Figure 2E).
Using a live cell imaging assay described recently in Heideveld et al.31 and further developed (see Online Supplementary Figure S4), the role of the EPH receptor in macrophage-erythroblast interaction was investigated in the presence or absence of inhibitory peptide (Figure 3A). The number of interactions an individual macrophage makes with erythroblasts in each image frame is referred
B
C
A
D
E
Figure 2. Activated Integrin β1 on proerythroblasts is not affected by EPHB4 inhibition. (A) Representative contour plot of the erythroblasts at different stages of expansion on days (D) 3, 4 and 5 of culture (n=5). IgG is in red, and antibodies are in blue. (B) Graph showing the percentage of cells with active integrin obtained by flow cytometry of these cells with the active form of integrin β1 (clone HUTS-21) through D3, D4 and D5 of erythroblast expansion (n=4). Mixed effects analysis was run on the samples. (C) Graph showing the mean fluorescence intensity (MFI) of active integrin β1 through D3 and D5 of expanding erythroblasts and after stim- ulation with manganese (Mn+; n=4). (D) Graph showing the MFI value obtained by flow cytometry of the ephrin-B2 construct binding on D3 and D5 of expansion of the erythroblasts with 15-minute treatments of either no peptide, a control peptide (DYP), or an EphB4 inhibitor (TNYL) (n=3). (E) Graph showing the percentage of cells obtained by flow cytometry expressing the active form of integrin β1 (clone HUTS-21) on D3 and D5 of erythroblast expansion with 15-minute treatments of either no peptide, a control peptide (DYP), or an EphB4 inhibitor (TNYL) (n=2). The error bars represent the standard error of the mean. Comparison between the samples was conducted using one-way ANOVA: ns: not significant; *P≤0.05. AU: arbitrary units.
918
haematologica | 2020; 105(4)
