
Page 75 - Haematologica April 2020
P. 75
EPHB4 drives macrophage-erythroblasts interactions
AB
CD
E
F
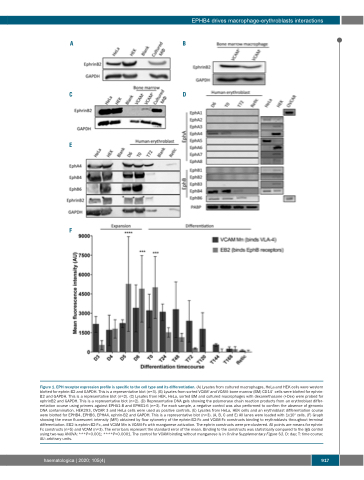
Figure 1. EPH receptor expression profile is specific to the cell type and its differentiation. (A) Lysates from cultured macrophages, HeLa and HEK cells were western blotted for ephrin-B2 and GAPDH. This is a representative blot (n=3). (B) Lysates from sorted VCAM+ and VCAM- bone marrow (BM) CD14+ cells were blotted for ephrin- B2 and GAPDH. This is a representative blot (n=2). (C) Lysates from HEK, HeLa, sorted BM and cultured macrophages with dexamethasone (+Dex) were probed for ephrinB2 and GAPDH. This is a representative blot (n=2). (D) Representative DNA gels showing the polymerase chain reaction products from an erythroblast differ- entiation course using primers against EPHA1-8 and EPHB1-6 (n=3). For each sample, a negative control was also performed to confirm the absence of genomic DNA contamination. HEK293, OVCAR 3 and HeLa cells were used as positive controls. (E) Lysates from HeLa, HEK cells and an erythroblast differentiation course were blotted for EPHB4, EPHB6, EPHA4, ephrin-B2 and GAPDH. This is a representative blot (n=3). (A, B, C and E) All lanes were loaded with 1x10⁶ cells. (F) Graph showing the mean fluorescent intensity (MFI) obtained by flow cytometry of the ephrin-B2-Fc and VCAM-Fc constructs binding to erythroblasts throughout terminal differentiation. EB2 is ephrin-B2-Fc, and VCAM Mn is VCAM-Fc with manganese activation. The ephrin constructs were pre-clustered. All points are means for ephrin- Fc constructs (n=5) and VCAM (n=3). The error bars represent the standard error of the mean. Binding to the constructs was statistically compared to the IgG control using two-way ANOVA: ***P<0.001; ****P<0.0001. The control for VCAM binding without manganese is in Online Supplementary Figure S3. D: day; T: time course; AU: arbitrary units.
haematologica | 2020; 105(4)
917
