
Page 195 - Haematologica April 2020
P. 195
Daratumumab in B-NHL
compared to the isotype control (42%, P< 0.01). CHOP alone marginally reduced tumor growth (P=0.182) and no difference was observed between daratumumab and D- CHOP groups (P=0.451). Importantly, adding rituximab to D-CHOP treatment (R-D-CHOP) induced a significant reduction in tumor volume compared to the isotype con- trol (86%, P<0.001) and also compared to R-CHOP (73%, P<0.001) and D-CHOP (51%, P< 0.05) alone. Similarly, in the tFL model (Figure 5C-D), daratumumab treatment inhibited tumor growth compared to isotype control (36%, P<0.001). On the other hand, the combination D- CHOP inhibited tumor growth significantly better than daratumumab as a single agent (57%, P<0.001), resem- bling that achieved by R-CHOP (67%, P<0.001). In addi- tion, the combination regimen of R-D-CHOP had a remarkable effect in impeding tumor growth (84% inhi- bition, P<0.001), which was superior than that achieved by each combination regimen separately (P<0.001). The results of the RL-luc model were further validated by bio- luminescence and quantification of the signal captured at the endpoint (Online Supplementary Figure S5A-B).
Moreover, tissue sections of selected mice of each group were analyzed by immunohistochemistry for the prolifer- ation marker pH3 and the angiogenesis marker CD31, further confirming these results (Online Supplementary Figure S5C).
In conclusion, these data demonstrate the value of the combination R-D-CHOP as a new therapeutic strategy in MCL and tFL superior to the standard-of-care (R-CHOP).
Daratumumab induces tumor growth inhibition and prolongs survival in a patient-derived DLBCL xenograft model in combination with R-CHOP
To further evaluate the activity of daratumumab alone or in combination with the standard-of-care therapy we used a clinically more relevant patient-derived DLBCL xenograft model (ST1361) with detectable CD38 expres- sion by immunohistochemistry (Online Supplementary Figure S6). Identical to the MCL and tFL models, all indi- vidual treatments were capable of reducing tumor volume over time (P<0.001, Figure 6A); however, daratumumab alone was strikingly efficient with an anti-tumor activity
AB
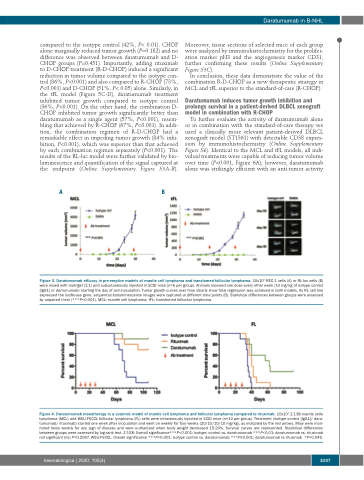
Figure 3. Daratumumab efficacy in pre-emptive models of mantle cell lymphoma and transfomed follicular lymphoma. 10x106 REC-1 cells (A) or RL-luc cells (B) were mixed with matrigel (1:1) and subcutaneously injected in SCID mice (n=6 per group). Animals received one dose every other week (10 mg/kg of isotype control [IgG1] or dartumumab) starting the day of cell inoculation. Tumor growth curves over time clearly show total regression was achieved in both models. As RL cell line expressed the luciferase gene, sequential bioluminescence images were captured at different time points (B). Statistical differences between groups were assessed by unpaired t-test (***P<0.001). MCL: mantle cell lymphoma; tFL: transfomed follicular lymphoma.
Figure 4. Daratumumab monotherapy in a systemic model of mantle cell lymphoma and follicular lymphoma compared to rituximab. 10x106 Z-138 mantle celle lymphoma (MCL) and WSU-FSCCL follicular lymphoma (FL) cells were intravenously injected in SCID mice (n=10 per group). Treatment (isotype control [IgG1]/ dara- tumumab/ rituximab) started one week after inoculation and went on weekly for four weeks (20/10/10/10 mg/kg), as indicated by the red arrows. Mice were mon- itored twice weekly for any sign of disease and were euthanized when body weight decreased 15-20%. Survival curves are represented. Statistical differences between groups were assessed by log-rank test. Z-138: Overall significance***P<0.001; Isotype; control vs. daratumumab ***P<0.01; daratumumab vs. rituximab not signficant (ns) P=0.2907. WSU-FSCCL: Overall significance ***P<0.001; isotype control vs. daratumumab ***P≤0.001; daratumumab vs rituximab *P=0.045.
haematologica | 2020; 105(4)
1037
