
Page 165 - Haematologica April 2020
P. 165
CD99 overexpression in AML
ABCD
EFGH
IJK
LM
NOPQ
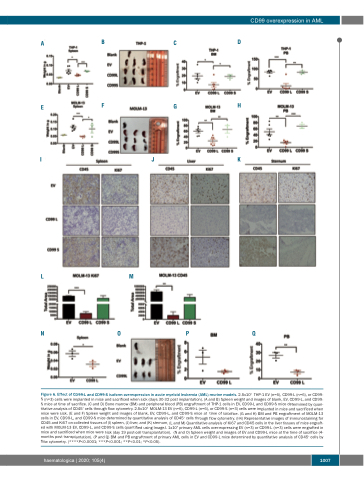
Figure 6. Effect of CD99-L and CD99-S isoform overexpression in acute myeloid leukemia (AML) murine models. 2.5x10⁶ THP-1 EV (n=6), CD99-L (n=6), or CD99- S (n=3) cells were implanted in mice and sacrificed when sick (days 30-32 post implantation). (A and B) Spleen weight and images of blank, EV, CD99-L, and CD99- S mice at time of sacrifice. (C and D) Bone marrow (BM) and peripheral blood (PB) engraftment of THP-1 cells in EV, CD99-L and CD99-S mice determined by quan- titative analysis of CD45+ cells through flow cytometry. 2.5x10⁶ MOLM-13 EV (n=6), CD99-L (n=6), or CD99-S (n=3) cells were implanted in mice and sacrificed when mice were sick. (E and F) Spleen weight and images of blank, EV, CD99-L, and CD99-S mice at time of sacrifice. (G and H) BM and PB engraftment of MOLM-13 cells in EV, CD99-L, and CD99-S mice determined by quantitative analysis of CD45+ cells through flow cytometry. (I-K) Representative images of immunostaining for CD45 and Ki67 on collected tissues of (I) spleen, (J) liver, and (K) sternum. (L and M) Quantitative analysis of Ki67 and CD45 cells in the liver tissues of mice engraft- ed with MOLM-13 EV, CD99-L, and CD99-S cells quantified using ImageJ. 1x10⁶ primary AML cells over-expressing EV (n=3) or CD99-L (n=3) cells were engrafted in mice and sacrificed when mice were sick (day 19 post-cell transplantation). (N and O) Spleen weight and images of EV and CD99-L mice at the time of sacrifice (4- months post transplantation). (P and Q) BM and PB engraftment of primary AML cells in EV and CD99-L mice determined by quantitative analysis of CD45+ cells by flow cytometry. (****P<0.0001; ***P<0.001; **P<0.01; *P<0.05).
haematologica | 2020; 105(4)
1007
