
Page 164 - Haematologica April 2020
P. 164
V.P. Vaikari et al.
compared with EV (7.29% vs. 19.47%; P=0.02) and CD99- S mice (7.29% vs. 18.9%; P=0.04) (Figure 6C). CD99-L mice had significantly less PB engraftment compared with EV (14.73% vs. 84.52 %; P=0.0002) and CD99-S mice (14.73% vs. 83.3 %; P=0.006) (Figure 6D and Online Supplementary Figure S9). No difference in engraftment was seen in the liver (Online Supplementary Figure S10A) or spleen (Online Supplementary Figure S10B) between groups.
In the MOLM-13 murine model, mice were engrafted with CD99-L, CD99-S and EV mice (n=6 for EV and CD99- L, and n=3 for CD99-S) and were sacrificed on day 19 post transplantation. Mice engrafted with CD99-L cells had smaller spleens than EV mice (0.048g vs. 0.11g, P=0.004) and CD99-S mice (0.048g vs. 0.10g, P=0.026). (Figure 6E and F). CD99-L mice had significantly less engraftment than the EV mice in the BM (25.38% vs. 59.57%, P=0.003) (Figure
A
B
C
6G), PB (15.03% vs. 50.5%, P=0.0051) (Figure 6H), and liver (21.6% vs. 44.03%, P=0.011) (Online Supplementary Figures S10C and S11). No difference in engraftment was seen in spleen (Online Supplementary Figure S10D). Additionally, to determine whether mice engrafted with CD99-L cells developed deadly leukemia, two CD99-L engrafted mice were sacrificed only when mice appeared sick (days 29 and 44). We observed PB engraftment in both mice and in the BM of one mouse (Online Supplementary Figure S10). Hematoxylin & Eosin staining of the liver, spleen and ster- num showed that EV and CD99-S tissues presented a high- er percentage of infiltrated blasts compared with the CD99- L mice tissues (Online Supplementary Figure S10). We also found higher CD45 immunostaining (CD99-L vs. EV, P=0.004; CD99-L vs. CD99-S, P=0.13) and Ki67 staining (CD99-L vs. EV, P=0.0002; CD99-L vs. CD99-S, P=0.17) in
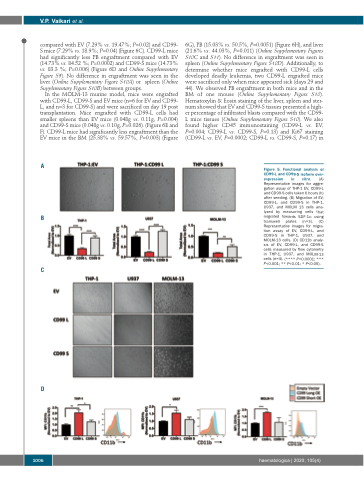
Figure 5. Functional analysis of CD99-L and CD99-S isoform over- expression in vitro. (A) Representative images for aggre- gation assay of THP-1 EV, CD99-L and CD99-S cells taken 6 hours (h) after seeding. (B) Migration of EV, CD99-L, and CD99-S in THP-1, U937, and MOLM 13 cells ana- lyzed by measuring cells that migrated towards SDF-1α using transwell plates (n=3). (C) Representative images for migra- tion assay of EV, CD99-L, and CD99-S in THP-1, U937, and MOLM-13 cells. (D) CD11b analy- sis of EV, CD99-L, and CD99-S cells measured by flow cytometry in THP-1, U937, and MOLM-13 cells (n=4). (**** P<0.0001; *** P<0.001; ** P<0.01; * P<0.05).
D
1006
haematologica | 2020; 105(4)
