
Page 222 - Haematologica March 2020
P. 222
C. Martín-Cortázar et al.
pressed in multiple tumors34 and their overexpression is critical for carcinoma invasion and metastasis formation.35 MMP2 and MMP9, in particular, degrade type IV collagen, a major component of the basement membrane, and thus facilitate tumor invasion.4 MMP9 is also required for intravasation, extravasation, and local migration of tumor cells.36
Infiltrating non-tumoral lymphocytes often express ele- vated MMP levels.37 In fact, the capacity of these cells to penetrate through basement membrane equivalents in vitro is facilitated by active MMP2 and MMP9.38 In addition,
MMP9 was found on the surface of B-cell chronic lympho- cytic leukemia cells, where it is a critical regulator of cell migration.39 MMP2 or MMP9 is also found in some lym- phoma cell lines.40 Nonetheless, none of the lymphoma cells used in our study expresses these MMP, indicating that CDCA7 does not regulate the capacity for invasion of these cells through these proteins. We cannot rule out however that CDCA7 may potentially promote lym- phoma invasion through paracrine stimulation of MMP2/9 production by neighboring stromal cells or through the regulation of other MMP. Alternatively,
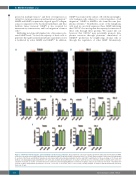
AB
CD
F
E
Figure 5. CDCA7 knockdown impairs actin and tubulin cytoskeletons polarization. BL-2 and Toledo cells were transduced with the indicated short hairpin (sh) RNA, seeded on coverslips coated with 2 mg fibronectin, and stimulated with 10 ng/mL stromal cell-derived factor 1 for 15 min. Representative confocal microscopy images (1 section) of (A) Toledo and (B) BL-2 transduced cells stained with anti-α-tubulin, phalloidin (F-actin), and DAPI. Quantification of the percentage of (C) Toledo and (D) BL-2 cells displaying polarized distribution of F-actin and α-tubulin. (E) Quantification of relative F-actin fluorescence intensity and (F) α-tubulin and F-actin colo- calization measured as relative correlation (Pearson coefficient) and overlapping (Mander coefficient) of signals. Data are presented as the mean + standard error of mean of three independent experiments. *P<0.05, **P<0.01, ***P<0.001, and ****P<0.0001 (one-way analysis of variance with the Bonferroni post-test). Scale bar, 10 mm.
736
haematologica | 2020; 105(3)
