
Page 62 - 2019_12-Haematologica-web
P. 62
L. Varricchio et al.
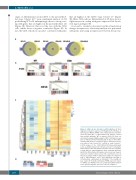
stages of differentiation from CD34+ to the proerythrob- last stage (‘cluster 16’),39 gene enrichment analysis of d11 proliferating WT cells unsurprisingly shows a strong over- lap with genes that are highest in the proerythroblast cell (Figure 3B). However, this is not the case with the CDA cells, which show a negative correlation (Figure 3B). In fact, the CDA cells show a positive correlation with genes
A
B
that are highest at the CD34+ stage (‘cluster 1')39 (Figure 3B). Once CDA cells are differentiated at d5, they show a slight increase in overlap with genes expressed late (brack- eted region in Figure 3B).
As an aid to visualize subsequent erythroid maturation changes in expression, a heat map analysis was performed with genes increasing in expression between the proery-
C
D
Figure 3. CDA cells are defective in differentiation. (A) Venn diagrams of all genes expressed ≥5 Fragments Per Kilobase of transcript per Million (FPKM) and compared between prolifer- ation day [d11, d15, or differentiation d5 samples, derived from normal (wild-type, WT) or patient (CDA)]. (B) Gene set enrichment analysis (GSEA) analysis of WT or CDA patient sam- ples as indicated from proliferating d11 (P d11) or after differ- entiation (Diff d5) were compared to genes enriched for expres- sion either at late (‘cluster 16’, n=268) or early (‘cluster 1’, n=174) stages of the CD34+/BFU-E/CFU-E/proerythroblast series as identified by Li et al.39 (shown as insets in each graph). Red brackets in the CDA samples show the increase in positive overlap with late expressing genes when comparing proliferat- ing d11 to differentiation d5 samples. Inserts are heat maps of cluster 16 or cluster 1 from Li et al.39 ES: enrichment score. (C) Heat map analysis of WT or CDA patient samples in conjunction with a differentiation series (proerythroblast through to orthochromatic erythroblast as indicated).46 The starting set was ‘cluster 16’ from (B). (D) Relative FPKM expression values of GATA2 and RUNX1 from the proliferation/differentiation series, grouped together and color-coded as in Figure 2.
2376
haematologica | 2019; 104(12)
