
Page 64 - 2019_12-Haematologica-web
P. 64
L. Varricchio et al.
A
BC
D
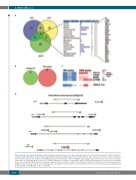
Figure 4. Ectopic expression in CDA samples. (A) Venn diagram showing overlap between genes uniquely expressed in CDA proliferation day (d)11 (d11U), d15 (d15U), and differentiation d5 (diff 5U) samples (Online Supplementary Table S2). DAVID analysis of terms enriched in the triple overlap between these samples (184 genes total) is shown, as are the top 35 genes most highly expressed in this enriched set. (B) Venn diagram of genes whose expression increases in the absence of KLF129 compared to the CDA-unique gene list from (A). (C) Relative Fragments Per Kilobase of transcript per Million (FPKM) expression values of four of the top CDA-unique genes of the proliferation/differentiation series grouped together and color-coded as in Figure 2. Also included are data for CXCL8 (IL8), which is downstream target of IL17RB. (D) Genome browser layouts of the CDA-unique genes showing the location of perfect nucleotide matches to the novel consensus sequence potentially bound by KLF1-E325K (5’CCMCCCCCN3’ on the C-rich strand).
2378
haematologica | 2019; 104(12)
