
Page 157 - 2019_12-Haematologica-web
P. 157
c-Abl/NIK limits the efficacy of Aurora inhibitors
alone or in co-culture with HS-5 stromal cells (Figure 2A). Importantly, NIK-in synergized with pan-AKI to kill MM cells (Figure 2B and Online Supplementary Table S1). Furthermore, adherence of MM cells to HS-5 stromal cells conferred significant protection against pan-AKI-induced cell death in the majority of the HMCL analyzed. However, this protective effect was significantly reduced by NIK inhibition (Figure 2A), thus confirming the impor- tant role of NIK in the stroma-mediated pan-AKI protec- tion. Finally, NIK-in significantly (P<0.005; n=10) increased the cytotoxicity of pan-AKI in patient-derived primary MM cells (Figure 2C and Online Supplementary Figure S2A), with no significant differences in the response rates between newly diagnosed (n=3) and relapsed (n=7) patients (Online Supplementary Figure S3) but not on PBMC from healthy individuals (Figure 2C and Online Supplementary Figure S2B). These observations thereby indicate that NIK plays an important role in the respon- siveness of MM cells to pan-AKI. (Patients’ demographic
and clinical characteristics are summarized in Online Supplementary Table S2).
It is also important to highlight the fact that treatment of MM cells with the proteasome inhibitor bortezomib (currently the standard of care for MM) caused a strong accumulation of the NIK protein in the majority of the HMCL analyzed (Online Supplementary Figure S4A) and its chemical inhibition significantly enhanced the anti-myelo- ma effects of bortezomib, thereby indicating that NIK can influence the sensitivity of MM cells to this drug (Online Supplementary Figure S4B).
NF-κB-inducing kinase interferes with the inhibitory activity of pan-AKI on NF-κB-inducing kinase
To examine whether NIK accumulation induced by pan- AKI counteracts their ability to inhibit NF-κB pathways in MM cells, we blocked its function with a NIK-specific siRNA and monitored NF-κB activity in response to pan- AKI. We found that in 4 of 5 HMCL tested (except OPM-
A
B
C
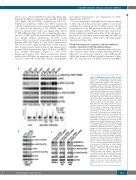
Figure 5. NF-κB-inducing kinase (NIK) accumu- lation induces c-Abl activation. (A) Western blot analysis of phospho-JAK2 (Tyr1007/1008), JAK2, phospho-SRC (Tyr416), SRC, phospho-c- Abl (Tyr245) and c-Abl kinases in multiple myelo- ma (MM) cell lines treated with MK-0457 (0.4 μM) for 24 hours (h); anti-Actin was performed as loading control. Bands were then subjected to densitometric scanning and levels of phospho- JAK2 (Tyr1007/1008), phospho-SRC (Tyr416), and phospho-c-Abl (Tyr245) were normalized to total JAK2, SRC, and c-Abl levels. Densitometric values of the ratio of phosphorylated c-Abl/total c-Abl are shown below the blots. The graph below represents the phosphorylation status of JAK2, SRC and c-Abl; changes (folds increase or decrease) in the levels of each phosphorylated protein relative to untreated control was taken as 1 (mean±Standard Deviation (SD) of 3 inde- pendent blots; °P<0.01, *P<0.005, vs. untreat- ed control cells, Dunnett test). (B) NIK expres- sion of RPMI-8226-NIK cells was inhibited by siRNA silencing; after 24 h transfected and untransfected cells were subjected to western blot analysis to monitor the expression of NIK, phospho-c-Abl (Tyr245), phospho-c-Abl (Tyr412), c-Abl, phospho-STAT3 (Tyr705), STAT3 and Actin as loading control. Protein expression of siRNA transfected 8226-NIK cells was compared to empty vector (EV) transfected control 8226 cells. Bands were then subjected to densitometric scanning: c-Abl and STAT3 phosphorylations were normalized to total c-Abl and STAT3 levels, respectively. The relative fold change of protein levels was normalized with respect to 8226-NIK untransfected condition, which was taken as 1 and are reported under each blot. (C) MM cell lines were transfected with siRNA against Aurora A and Aurora B (AURK A+B) or control siRNA. After 48 h transfected MM cell lines were sub- jected to western blot analysis to monitor the expression of Aurora A and B, phospho-c-Abl (Tyr245), phospho-c-Abl (Tyr412), c-Abl and Actin as loading control. c-Abl phosphorylations were subjected to densitometric scanning and were normalized to c-Abl levels. The relative fold change of protein levels was normalized with respect to the level of the untreated control, which was taken as 1, and is shown under each lane.
haematologica | 2019; 104(12)
2471
