
Page 156 - 2019_12-Haematologica-web
P. 156
L. Mazzera et al.
A
BCD
E
F
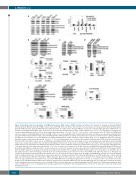
Figure 4. Pan-AKI-mediated accumulation of NF-κB-inducing kinase (NIK) induces STAT3 activation. (A) Wesern blot analysis of endogenous phospho-ERK1/2 (Thr202/Tyr204), ERK1/2 and Actin in MM cell lines treated with MK-0457 (0.4 μM) for 24 hours (h). The same lysates were prepared and immunoblotted against phospho-STAT3 (Ser727), phospho-STAT3 (Tyr705), STAT3 and Actin as loading control. Phospho-ERK1/2 and Ser727- and Tyr705-phosphorylated STAT3 were nor- malized to total ERK1/2 and STAT3 levels, respectively. In the graph, the phosphorylations under control conditions were set as 1 for comparison. In histogram are shown means±Standard Deviation (SD) of three independent experiments (°P<0.05, *P<0.01, **P<0.005 vs. control, Dunnett test). (B) OPM-2 and RPMI-8226 cells were transfected with NIK siRNA and after 3 h MM cell lines were treated with MK-0457 (0.4 μM). After 48 h whole cell lysates were prepared and immunoblot- ted against NIK, phospho-STAT3 (Ser727), phospho-STAT3 (Tyr705), STAT3 and Actin as loading control. Bands were subjected to densitometric scanning. STAT3 phos- phorylations were normalized to overall STAT3 levels. STAT3 phosphorylations under untreated control condition were set to 1. Histograms below represent the mean±SD of three independent experiments. (*P<0.01, **P<0.005, Tukey-Kramer test). (C) Wesern blot analysis of NIK, phospho-STAT3 (Ser727), phospho-STAT3 (Tyr705), STAT3 and Actin in stable clones of RPMI-8226 and RPMI-8226/R5 transfected with empty vector or with plasmid expressing NIK. All western blotting results were evaluated by densitometric scanning, and histograms represent the relative levels of phospho-STAT3 corrected with respect to Actin and normalized to STAT3 expression. In the graph below, STAT3 phosphorylations under control conditions (empty vector transfection) were set as 1 for comparison. Histogram repre- sents the mean±SD of five independent experiments. (*P<0.001 vs. empty vector, Dunnett test). (D) NIK expression of RPMI-8226-NIK and RPMI-8226/R5-NIK cells was inhibited by siRNA silencing; after 24 h cells were subjected to western blot analysis to monitor the expression of NIK, phospho-STAT3 (Ser727), phospho-STAT3 (Tyr705), STAT3 and Actin as loading control. Bands were subjected to densitometric scanning and STAT3 phosphorylations were normalized to total STAT3 levels. In the graph below, the relative fold change of protein levels was normalized with respect to the level of the control siRNA (cont), which was taken as 1. Histogram rep- resents the mean±SD of five independent experiments (*P<0.001 vs. untreated control, Dunnett test). (E) OPM-2 and RPMI-8226 cell lines were treated with MK- 0457 (0.4 μM) and after 24 h of treatment were lysed and subjected to immunoprecipitation (IP) using anti-NIK antibody or anti-STAT3 antibody or control antibody (IgG) and immunoblotted (IB) with either NIK or STAT3 antibodies. Western blot results were subjected to densitometric scanning and the histogram on the right shows average quantification results±SD of the association NIK/STAT3 from 3 immunoprecipitations (*P<0.0001 vs. untreated control cells, Dunnet and Tukey- Kramer tests). Anti-NIK immunoprecititate Filters stripped and reprobed for phospho-STAT3 (Ser727), phospho-STAT3 (Tyr705) and subjected to densitometric analy- sis (F); histograms represent the relative levels of phospho-STAT3 corrected with respect to IgG and normalized to STAT3 expression. STAT3 phosphorylations under control conditions were set as 1. Histograms show average quantification results±SD of three independent blots (*P<0.005, vs. untreated control cells, Dunnett and Tukey-Kramer tests).
2470
haematologica | 2019; 104(12)
