
Page 146 - 2019_12-Haematologica-web
P. 146
F. Späth et al.
A
B
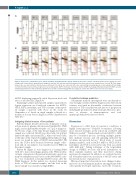
Figure 2. Trajectories of biomarker levels among 65 future myeloma patients and 65 matched cancer-free controls. (A) Mean plasma levels (pg/mL) for cases (orange) and controls (blue), grouped by pre-diagnostic baseline (S1) and repeated (S2) samples. Error bars represent the standard error of mean. (B) Fold change between the case and control for matched case-control pairs. S1 and S2 are connected with a line representing increasing (green) or decreasing (red) fold change over time. Bold lines represent linear regression over all data points. MCP-3: monocyte chemotactic protein-3; MIP: macrophage inflammatory protein; VEGF: vascular endothelial growth factor; FGF-2: fibroblast growth factor-2; TGF-a: transforming growth factor-alpha; IL: interleukin, TNF-a: tumor necrosis factor-alpha.
MGUS displaying temporally stable M-protein levels and ratios of involved FLC (Figure 4).
Analyzing baseline and repeated samples separately by logistic regression, we found risk estimates for MCP-3, VEGF, FGF-2, fractalkine, and TGF-a at time of the repeat- ed sample consistent with those in the study by Vermeulen et al. based on single samples collected at a median of 6 years before diagnosis (Online Supplementary Table S3).12
Intriguing clinical courses of two patients
Patient 2 (Figure 1) had bone lesions, dominance of clon- al bone marrow plasma cells, increased lambda FLC (9560 mg/L), and an IgA lambda M-spike of 1.7 g/L at diagnosis. At 30 years of age, at the time the pre-diagnostic baseline sample was collected, MGUS was detectable (1.2 g/L IgA lambda M-spike and normal FLC). Almost 20 years later, at the time of the repeated sampling (42 months pre-diag- nosis), we found no signs of MGUS and normal FLC. Of note, the TGF-a level decreased between sample collec- tions and, in our analyses, was classified as low (ROC) in the repeat sample.
Patient 56 (Figure 1) was diagnosed as having SMM with 12% monoclonal kappa plasma cells. Without clini- cal signs of progression the patient underwent a new bone marrow examination and, based on the 2003 IMWG crite- ria,19 was reclassified as having MGUS 6 years after the SMM diagnosis. In this patient we observed increasing levels of TGF-a between samples, and the level in the repeat sample was classified as high (ROC).
Correlation between predictors
All immune markers investigated were moderately to very strongly correlated (Online Supplementary Table S4). In contrast, we found no discernable correlations between measures of TGF-a and known risk factors of progression including M-protein level, M-protein type, FLC ratio, pres- ence or absence of immunoparesis, and total immunoglobulin levels (data not shown).
Discussion
Progression to MM from its precursor conditions is highly heterogeneous.24 Reliable biomarkers allowing more tailored strategies in the follow-up of MGUS and SMM are needed.25 Transformation from MGUS to MM may be a branched process, involving multiple genetic hits, immune evasion, and cell signaling mediated by cytokines and growth factors.26 Blood levels of several immune markers, such as MCP-3, MIP-1a, VEGF, FGF-2, fractalkine, and TGF-a, have previously been associated with MM risk.12 Taking advantage of the longitudinal design of NSHDS, we here add novel information on these immune markers and their trajectories during myeloma development. In addition, we evaluated poten- tial biomarker trajectories in relation to MGUS status and known risk factors of progression.
Our most important observations were changes in plas- ma levels of several immune markers among patients who subsequently developed myeloma. Given the evolution-
2460
haematologica | 2019; 104(12)
