
Page 144 - 2019_12-Haematologica-web
P. 144
F. Späth et al.
er level, M-protein level,8 type of M-protein,22 FLC ratio,8 and depression of two uninvolved immunoglobulins,8 were examined by using a multivariable Cox proportional-hazard model. Testing the proportional hazards assumption of the applied Cox model, we found no indication of violation.23 These analyses were per- formed using SPSS, version 25 (IBM). All applied biostatistical tests were two-sided.
Results
Characteristics of myeloma patients
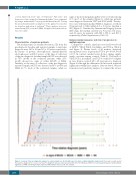
The median times (± standard deviation, SD) from the pre-diagnostic baseline and repeated samples to myeloma diagnosis were 12.8 ± 4.5 and 3.9 ± 3.8 years, respectively. By means of protein electrophoresis, immunofixation electrophoresis, and FLC assays, at the time of collection of the pre-diagnostic baseline sample MGUS was detected in 75% (n=46) of the evaluated patients, while 25% (n=15) showed no signs of either MGUS or SMM. Similarly, at the time of collection of the pre-diagnostic repeated sample, MGUS was detected in 82% (n=50) and SMM in 7% (n=4) of the evaluated samples, while no
signs of monoclonal gammopathy were yet found among 11% (n=7) of the samples (Figure 1). Myeloma patients were diagnosed between 1997 and 2013 (n=65). Twenty- two cases with myeloma had SMM at diagnosis, of whom 15 progressed to MM within 2.4 ± 4.4 years (median ± SD) (Figure 1). Stratified by International Staging System (ISS) stage, the median survival was 9.6 years, 5.4 years, and 4.4 years for patients with ISS 1, ISS 2, and ISS 3, respectively (Online Supplementary Table S1).
Immune marker measures and risk of progression to multiple myeloma
Compared to controls, myeloma cases had lower levels of MCP-3, VEGF, FGF-2, fractalkine, and TGF-a (Table 2 and Figure 2). Plasma levels of all markers decreased among future cases, in particular TGF-a (β= -0.019, P=2.5 x 10⁻⁴). In contrast, marker levels did not change signifi- cantly over time among controls (Table 2). The levels of VEGF, FGF-2, fractalkine, and TGF-a seemed to be higher in cases than in controls 20 to 25 years prior to diagnosis (Figure 2) although the differences did not reach statistical significance within these analyses (data not shown). We per- formed several sensitivity analyses to evaluate the robust-
Figure 1. Overview of the pre-diagnostic samples for each included case (1-65) with respect to disease status during the study period. The x-axis is scaled around the myeloma diagnosis for a clearer overview. Pre-diagnostic disease status was determined for 61 individuals. MGUS: monoclonal gammopathy of undetermined significance; SMM: smoldering multiple myeloma; MM: multiple myeloma; NA: not available.
2458
haematologica | 2019; 104(12)
