
Page 145 - 2019_12-Haematologica-web
P. 145
Biomarkers of progression to multiple myeloma
ness of our findings. First, we excluded 25 myeloma cases who were part of a previous study using one pre-diagnos- tic blood sample for each participant.12 Results of these analyses rendered wider confidence intervals for β esti- mates but remained largely similar, without affecting the interpretation. Furthermore, we investigated the influence of repeated freezing and thawing by excluding previously thawed plasma samples (n=19), without finding evidence that this influenced the results. In addition, to evaluate whether individual participants influenced results particu- larly, we performed analyses by repeating all data model- ing with stepwise exclusion of each individual (leave-one- out). Excluding individual participants did not affect the interpretation of our results.
Considering the natural history of MM, we hypothe- sized that low immune marker levels in samples collected closer to diagnosis (pre-diagnostic repeated samples) might be associated with shorter time of progression to MM (Figure 2). Investigating this, ROC analyses indicated the potential to predict progression to MM for repeated measures of MCP-3, FGF-2, fractalkine, and TGF-a. Low
levels [defined by the ROC analyses (Online Supplementary Table S2)] of MCP-3, FGF-2, and TGF-a were associated with a shorter time to MM progression (Figure 3). The greatest accuracy in predicting progression to MM was observed for TGF-a at the time of the pre-diagnostic repeated sample [area under the curve (AUC) 0.75, 95% confidence interval (95% CI): 0.60-0.90] (Online Supplementary Figure S1). To investigate the value of TGF- a as a predictor of progression to MM, we included dichotomized levels in a multivariable Cox proportional- hazard model together with known risk factors for pro- gression. This model demonstrated that TGF-a remained an independent risk factor for progression (Table 3).
Risk-stratifying patients with MGUS at the time of the pre-diagnostic repeated sample into two groups, low- or low-intermediate risk and high-intermediate or high-risk MGUS, based on criteria suggested by Kyle et al.,4 showed that low plasma levels of TGF-a might be associated with shorter time to progression to MM among patients with low- and low-intermediate risk MGUS (Figure 4). Low lev- els of TGF-a might also add prognostic information to
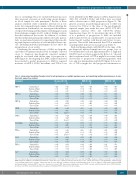
Table 2. Linear mixed modeling of marker levels for all myeloma cases, multiple myeloma cases and smoldering multiple myeloma cases in rela- tion to 65 cancer-free controls.
a Parameter
MCP-3
MIP-1a MIP-1β VEGF
FGF-2
Fractalkine
TGF-a IL-13 TNF-a IL-10
All cases (N = 65) MM (N = 43) SMM (N = 22) β P βb P βc P
Control-Cased Controls x Timee Cases x Timef
Control-Case Controls x Time Cases x Time
Control-Case Controls x Time Cases x Time
Control-Case Controls x Time Cases x Time
Control-Case Controls x Time Cases x Time
Control-Case Controls x Time Cases x Time
Control-Case Controls x Time Cases x Time
Control-Case Controls x Time Cases x Time
Control-Case Controls x Time Cases x Time
Control-Case Controls x Time Cases x Time
-0.129 0.029 -0.002 0.560 -0.008 0.011
-0.018 0.776 -0.006 0.094 -0.010 0.004
-0.063 0.143 -0.003 0.214 -0.009 9.9 x 10⁻⁵
-0.128 0.021 -0.001 0.820 -0.012 2.2 x 10⁻⁴
-0.101 0.024 -0.002 0.324 -0.010 4.0 x 10⁻⁵
-0.090 0.026 -0.002 0.496 -0.007 0.004
-0.206 0.029 -0.001 0.852 -0.019 2.5 x 10⁻⁴
-0.118 0.238 -0.003 0.628 -0.011 0.053
-0.049 0.318 -0.003 0.306 -0.006 0.014
-0.093 0.314 -0.007 0.203 -0.013 0.016
-0.153 0.028 -0.002 0.560 -0.008 0.032
-0.046 0.515 -0.006 0.091 -0.011 0.005
-0.083 0.094 -0.003 0.243 -0.009 0.001
-0.170 0.009 -0.001 0.794 -0.013 0.001
-0.128 0.014 -0.003 0.348 -0.010 0.002
-0.131 0.005 -0.002 0.531 -0.008 0.004
-0.260 0.018 -0.001 0.870 -0.020 0.002
-0.165 0.146 -0.003 0.582 -0.014 0.049
-0.082 0.138 -0.003 0.344 -0.007 0.027
-0.155 0.145 -0.007 0.220 -0.014 0.036
-0.067 0.420 -0.002 0.601 -0.005 0.405
0.050 0.591 -0.006 0.109 -0.006 0.349
-0.023 0.722 -0.002 0.245 -0.008 0.069
-0.035 0.641 -0.001 0.775 -0.009 0.161
-0.047 0.476 -0.002 0.339 -0.011 0.024
0.003 0.965 -0.002 0.460 -0.002 0.662
0.088 0.528 -0.001 0.841 -0.015 0.125
-0.028 0.849 -0.003 0.604 -0.006 0.570
0.022 0.760 -0.003 0.346 -0.004 0.415
0.039 0.772 -0.007 0.186 -0.009 0.361
aAll concentration data were log10-transformed and winsorized prior to modeling. bAnalyses restricted to cases who had MM at diagnosis. cAnalyses restricted to cases who had SMM at diagnosis.dDifference in marker levels between controls and cases (negative β indicates lower levels for cases).eInteraction term for controls with time (negative β indi- cates declining marker levels over time). fInteraction term for cases with time (negative β indicates declining marker levels closer to diagnosis). MM: multiple myeloma; SMM smoldering multiple myeloma; MCP-3: monocyte chemotactic protein-3; MIP: macrophage inflammatory protein; VEGF: vascular endothelial growth factor; FGF-2: fibroblast growth factor-2;TGF-a:transforming growth factor-alpha;IL:interleukin,TNF-a:tumor necrosis factor-alpha.
haematologica | 2019; 104(12)
2459
