
Page 67 - 2019_11 Resto del Mondo-web
P. 67
Loss of Notch1 TAD interferes with niche recovery
was confirmed by western blot analysis (Figure 5E, right).
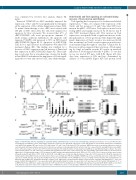
Both Notch1 and Tie2 signaling are activated during recovery of bone marrow endothelium
Tie2 signaling has been proposed to facilitate endothelial regeneration.2,39 Thus, we compared the expression of the Notch1 and Tie2 receptors 3, 5, and 7 days after 5-FU treat- ment in the pBEC of WT mice. Tie2 expression was low in resting pBEC and rapidly increased by 10-fold at day 5 after 5-FU treatment (Figure 6A). This increase in Tie2 expression corresponded with a significant increase in the phosphorylation of Tie2 protein (p-Tie2) (Figure 6B, right panel). Expression of Notch1 receptor was increased 4-fold after treatment, but Notch1 receptor expression and activa- tion remained high throughout until day 7 (Figure 6A, B). Previous work has suggested that activation of Tie2 signal- ing by Ang1 in human vascular EC results in increased induction of Notch ligand delta-like 4 (Dll4).40 To test this in vivo, we treated WT mice with 5-FU (Figure 6C). Five days later, expression of Dll4 and Jag1, determined by analysis of both mRNA (Figure 6D) and protein levels
Increased ICNΔTAD in cBEC markedly impaired the expression of Hey1 and Dtx1 and significantly downregulat- ed the expression of Myc (Online Supplementary Figure S8D). To mimic chemotherapy in vitro, cBEC were treated with 100 mM of 5-FU. After 24 h, the cells were analyzed for apoptosis by flow cytometry. We observed that 27% of cBEC-ICNΔTAD cells were pro-apoptotic (annexin V+) under resting conditions; furthermore, the apoptotic cells (annexin V+/DAPI+) cells increased to 50% in 5-FU-treated cBEC-ICNΔTAD (Figure 5F, G). Apoptosis of cBEC-ICNΔ- TAD led to a rapid decrease in cell numbers 48 h after 5-FU treatment (Figure 5H). This finding was validated by a decrease of Mcl-1 expression and an increase of Puma and Bax expression in cBEC-ICNΔTAD (Figure 5I). These find- ings corroborate the in vivo phenotype observed in freshly isolated BM EC and indicate the importance of Notch signal- ing in the recovery and survival of EC after chemotherapy.
AB
CDE
FG
Figure 6. Both Notch1 and Tie2 signaling are activated during endothelial niche recovery after chemotherapy. (A) Expression kinetics of Tie2 and Notch1 after chemotherapy. Quantitative reverse transcriptase polymerase chain reaction (RT-qPCR) expression of Tie2 and Notch1 in sorted CD31+ primary bone endothelial cells (pBEC) from wildtype (WT) mice before (CTL) and at days 3, 5 and 7 after 5-fluorouracil (5-FU) treatment. GAPDH was used as an internal expression control at each time-point. (B) Representative western blot of protein level analysis for phosphorylated Tie2 (p-Tie2), total Tie2, cleaved Notch1 and GAPDH from sorted pBEC before (CTL) and at days 3, 5 and 7 after 5-FU treatment (left panel). The band intensities of Tie2 and p-Tie2 in pBEC were quantified by ImageJ software. The ratios of pTie2/Tie2 at days 3, 5 and 7 after 5-FU treatment were normalized to that of the control (CTL) group. The fold changes of pTie2/Tie2 ratio are presented (n=3, right panel). (C) Experimental design of 5-FU treatment for pBEC analysis (phosphate-buffered saline, PBS, n=6; 5-FU, n=15). Five- to six-week old mice were treated intraperitoneally (IP) with PBS or 5-FU. CD31+Ter119-CD45- cells (pBEC) were sorted from digested bones 5 days after 5-FU treatment. (D) RT-qPCR expression of indicated genes from pBEC treated as described in (C). Values are normalized to PBS-treated pBEC. GAPDH was used as an internal expression control. (E) Protein expression of Dll4 and Jag1 was measured in pBEC from mice treated with PBS or 5-FU. GAPDH was used as a loading control (left panel). The band intensities of Dll4 and Jag1 in pBEC were quantitated by ImageJ software (n=3, right panel). (F) Experimental design of 5-FU injection of Notch1f/f;VE-CadherinCreERT2+ mice (left panel). Notch1f/f;VE-CadherinCreERT2 mice were injected IP with tamoxifen daily for 5 days. One week later, 5-FU was injected IP into Notch1f/f;VE-Cadherin CreERT2+ or CreERT2- littermates. pBEC were analyzed at day 5 after 5-FU injection (n=3). (G) Expression of Tie2, Dll4 and Jag1 was measured by RT-qPCR in pBEC as described in (F). Absolute expression values were compared to those of PBS-injected mice of each genotype. GAPDH was used as an internal expression control.
haematologica | 2019; 104(11)
2173
