
Page 152 - 2019_10 resto del Mondo_web
P. 152
L. Patrussi et al.
Reconstitution of p66Shc in chronic lymphocytic leukemia cells normalizes their CCR2 and CXCR3 expression
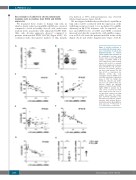
We translated these results to human CLL cells, in which a drastic reduction in p66Shc mRNA was observed compared to levels in healthy donor B cells, with lower residual levels in patients with unmutated IGHV (UM- CLL), who develop aggressive disease,35 compared to patients with mutated IGHV (M-CLL) (Figure 6A,B).6 No correlation with other genetic markers of CLL, namely
AB
CD
13q deletion or TP53 deletion/mutation, was observed (Online Supplementary Figure S9A,B).
We investigated whether the residual levels of p66Shc in CLL cells could be correlated with the expression of the trafficking receptors found to be modulated by p66Shc deficiency in Eμ-TCL1 leukemic cells. As reported,8 sur- face and mRNA levels of CCR7 and S1PR1 correlated inversely and directly, respectively, with p66Shc expres- sion in CLL cells from the patients included in this study (Figure 6C,D and Online Supplementary Figure S10A,B).
E
F
Figure 6. p66Shc deficiency is associated with abnormal expres- sion of chemokine receptors and lymphadenopathy in human chronic lymphocytic leukemia. (A, B) Quantitative real-time poly- merase chain reaction (qRT-PCR) analysis of p66Shc mRNA in B cells purified from either healthy donors (HD) (n=12) or patients with chronic lymphocytic leukemia (CLL) (n=157) (A), or B cells puri- fied from CLL patients, grouped into those with mutated CLL (M- CLL) (n=67) or unmutated CLL
(UM-CLL) (n=64)
Correlation between mRNA levels of p66Shc and surface expression levels of CCR7 (C), S1PR1 (D), CXCR4 (E), CCR2 (F) and CXCR3 (G) in B cells purified from CLL patients (n≤89). (H) qRT-PCR analysis of CCR2 (left) and CXCR3 (right) mRNA in purified CLL B cells (n=6), nucleofected with either empty vector (CLL vect) or an expression construct encoding p66Shc (CLL p66). The relative gene transcript abundance was determined on triplicate samples using the DDCt method. Mean ± standard deviation. Mann-Whitney rank sum test. ***P≤0.001" to "****P≤0.0001; ***P≤0.001".
(B). (C-G)
G
H
2048
haematologica | 2019; 104(10)
