
Page 154 - 2019_10 resto del Mondo_web
P. 154
L. Patrussi et al.
ABC
DEF
G
I
H
J
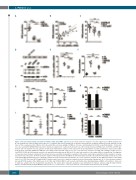
Figure 7. The pro-oxidant activity of p66Shc modulates CCR2 and CXCR3 expression. (A, C) Flow cytometric analysis of reactive oxygen species (ROS) production in B cells purified from either healthy donors (HD, n=7) or patients with chronic lymphocytic leukemia (CLL) grouped according to whether they had mutated CLL (M- CLL) (n=11) or unmutated CLL (UM-CLL) (n=9) (A) and in B1a cells from wildtype (C57BL/6, n=9) mice and from Eμ-TCL1 (n=13) or Eμ-TCL1/p66Shc-/- (n=12) sick mice (C), loaded with CM-H2DCFDA. Data refer to duplicate samples from each patient/donor/mouse. (B) Correlation between mRNA levels of p66Shc and ROS pro- duction in B cells purified from CLL patients (n=28). (D, E) Immunoblot analysis of Shc expression (D) and quantitative real-time polymerase chain reaction (qRT- PCR) analysis of p66Shc mRNA (E) in MEC1 B cells stably transfected with empty vector (ctr) or an expression construct encoding either wildtype p66Shc (p66) or the EE132/133QQ (p66QQ) mutant, and in B cells purified from healthy donors (HD) (n=3). A control anti-actin blot of the stripped filter is shown below. The migration of molecular mass markers is indicated. The domain structure of p66Shc showing the localization of the amino acid residues substituted in the mutants is schema- tized at the top of the panel. (F) Flow cytometric analysis of ROS production in the MEC1 B-cell transfectants and in B cells purified from healthy donors (B cell, n=5) loaded with CM-H2DCFDA. Data refer to duplicate samples from five independent experiments. (G, I). Flow cytometric analysis (G) and qRT-PCR analysis of the mRNA levels (I) of CCR2 (left) and CXCR3 (right) in MEC1 transfectants. Data refer to duplicate samples from five independent experiments. (H, J). Flow cytometric analysis (H) and qRT-PCR analysis of the mRNA levels (J) of CCR2 and CXCR3 in MEC1 cells treated for 24 h with either dimethylsulfoxide (DMSO) or 50 μM H2O2. Data refer to duplicate samples from four independent experiments. The relative gene transcript abundance was determined on triplicate samples using the ΔΔCt method. Mean ± standard deviation. Mann-Whitney rank sum test. ****P≤0.0001; ***P≤0.001**P≤0.01; *P≤0.05. MFI: mean fluorescence intensity.
2050
haematologica | 2019; 104(10)
