
Page 56 - 2019_09-HaematologicaMondo-web
P. 56
Z. Zhang et al.
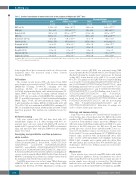
Table 1. Decline in production of mature blood cells in the periphery of Adipoq-Cre+;Kitlfl/fl mice.
13-week-old male 14-week-old female
Kitlfl/fl Adipoq-Cre+;Kitlfl/fl Kitlfl/fl Adipoq-Cre+;Kitlfl/fl
(n=6) (n=9) (n=8) (n=7)
RBC (x1012/L)
HGB (g/L) Hematocrit L/L
MCV (fL) Reticulocyte (x1012/L) Platelet (x109/L) Neutrophil (x109/L) Eosinophil (x109/L) Basophil( x109/L) Monocyte (x109/L)
Lymphocyte (x109/L)
10.54 ± 0.34
150.0 ± 3.7 0.493 ± 0.014 46.73 ± 0.50 0.29 ± 0.28 1193.2 ± 115.6 0.90 ± 0.33 0.23 ± 0.10 0.04 ± 0.02 0.06 ± 0.02
6.10 ± 2.08
8.68 ± 0.28 ***
137.6 ± 4.7 ***
0.450 ± 0.015 ***
51.91 ± 1.04 ***
0.34 ± 0.31 **
987.6 ± 99.9 **
0.45 ± 0.20 *
0.10 ± 0.06 *
0.01 ± 0.01 *
0.03 ± 0.01 *
3.71 ± 1.01 *
10.48 ± 0.40
152.0 ± 3.8
0.502 ± 0.026
47.89 ± 2.56
0.30 ± 0.04
1027.8 ± 104.3
0.87 ± 0.31
0.19 ± 0.11
0.04 ± 0.02
0.13 ± 0.05
5.67 ± 1.38
8.83 ± 0.27 ***
143.6 ± 4.5 ** 0.463 ± 0.018 ** 53.41 ± 2.28 *** 0.43 ± 0.11 * 806.4 ± 82.2 *** 0.38 ± 0.17 ** 0.13 ± 0.11
0.02 ± 0.01 0.04 ± 0.01 *** 3.73 ± 1.14 *
n: number; RBC: red blood cell counts; HGB: hemoglobin concentration; MCV: mean corpuscular volume. Data are presented as mean±Standard Deviation. *P<0.05; **P<0.01; ***P<0.001 by unpaired two-tailed t-test.
body weight). Blood glucose from tail-vein blood collected at the designated times was measured using a Bayer Contour Glucometer (9545C).
Cell culture
The stromal vascular faction (SVF) cells derived from iWAT were obtained as previously described.38 SVF cells were cultured in DMEM/F12 (Corning, 10-090-CV) containing 10% FBS (GenClone, 25-514), 1% penicillin/streptomycin (Gibco, 10378016), 20 nM insulin (Sigma), and 1 nM triiodothyronine (T3, Sigma, T6397). Two days after becoming confluent (defined as Day 0), SVF cells were induced with DMEM/F12 containing 10% FBS, 1% penicillin/streptomycin, 0.5 mM isobutylmethylxanthine (IBMX, Sigma, I7018), 125 μM indomethacin (Sigma, I7378), 1 μM dexamethasone (Sigma, D4902), 20 nM insulin, and 1 nM T3 for 48 h. Cells were maintained in DMEM/F12 containing 10% FBS, 1% penicillin/streptomycin, 20 nM insulin, and 1 nM T3 until lipid drop appeared. This medium was replenished every two days.
Oil Red O staining
Cells were washed with PBS and then fixed with 10% formaldehyde (Sigma) for 1 h. After washing with 60% iso- propanol, fixed cells were stained with Oil Red O solution (2 mg/mL in 60% isopropyl alcohol, Sigma, O-0625) for ten minutes (min), and rinsed five times with pure H2O before photographic images were taken.
Genotyping and quantitative real-time polymerase
chain reaction
Primers used for DNA amplification were: floxed-Kitl-F, CGAG- GTAGGGGAAAAGAACC; floxed-Kitl-R, GGATCTTCCCA- GAGGTTGGA; excised-Kitl-F, GGAAAAGAACCAAGT- GAAGTC; excised-Kitl-R, ACGGGGAAAGACCTCCGGTCC; Adipoq-Cre-F, GGAAAAGAACCAAGTGAAGTC; Adipoq-Cre- R, ACGGGGAAAGACCTCCGGTCC. DNA for verifying knock- out was isolated using the Quick-DNA Plus Kit (Zymo Research, #D4074). Genotyping was performed according to instructions in the manual provided by the Jackson Laboratory.
Total RNA from tissues was isolated using TRIzol (Invitrogen, 15596018). RNA was reverse-transcribed using iScript cDNA Synthesis Kits (Bio-Rad, 170-8891). Quantitative real-time poly-
merase chain reaction (qRT-PCR) was performed using SYBR Green Supermix (Bio-Rad, 1725124) with a C1000 Thermal Cycler (Bio-Rad) following the manufacturers’ instructions. For thermal cycling: 95°C, 3 min; then 40 cycles of 95°C, 10 seconds (s) and 60°C, 30 s. The primers used for qRT-PCR were long Kitl (flanking exon 5 and 6): 5’-GCCAGAAACTAGATCCTTTACTCCTGA-3’ and 5’-ACATAAATGGTTTTGTGACACTGACTCTG-3’; short Kitl (flanking junctions between exon 5/7 and exon 8/9): 5’-CCC- GAGAAAGGGAAAGCCG-3’ and 5’-ATTCTCTCTCTTTCT- GTTGCAACATACTT-3’; total Kitl (flanking exon 2 and 3): 5’- TCTGCGGGAATCCTGTGACT-3’ and 5’-CGGCGA- CATAGTTGAGGGTTAT-3’; excised Kitl (flanking exon 1 and 2, exon1 was floxed): 5’-CAGCGCTGCCTTTCCTTATGA-3’ and 5’-ATCAGTCACAGGATTCCCGC-3’, and the housekeeping gene 36b4: 5’-AGATGCAGCAGATCCGCAT-3’ and 5’- GTTCTTGCCCATCAGCACC-3’. Delta-delta Ct analysis was used to calculate relative gene expression.
Histology and immunostaining
Long bones were fixed in 10% neutral buffered formalin fol- lowed by three days of decalcification in 14% EDTA, followed by paraffin or OCT embedding. Bones embedded in paraffin were sectioned at 5 μm thickness using a microtome (Olympus Cut 4060) and stained with Hematoxylin and Eosin (H&E). For quan- tification of the BM adipocytes, the BM areas 4.5 mm from growth plate were selected. Bones embedded in OCT were sec- tioned at 7 μm thickness using a cryostat (Leica). Sections were blocked with 3% bovine serum albumin, 0.2% TWEEN 20 in Tris- buffered saline, incubated with chicken-anti-GFP (Aves, GFP- 1020, 1:1,000), rabbit-anti-perilipin (Cell Signaling Technology, #9349, 1:200) overnight, and secondary antibodies (Alexa Fluor 488 anti-Chicken IgG and Alexa Fluor 674 anti-Rabbit IgG, Life Technologies, 1:400) for 1 h. A Nikon system was used for fluo- rescence detection.
Western blot
Tissue proteins were extracted using RIPA buffer with freshly added proteinase inhibitors. Protein concentrations were deter- mined using BCA Protein Assay Kit (Pierce). Equal amounts of protein samples were subjected to western blot. The following antibodies were used: anti-UCP1 (Abcam, ab209483, 1:5000 dilu- tion), anti-PGC-1a (Bioworld, BS72263, 1:500 dilution), anti-PER-
1734
haematologica | 2019; 104(9)
