
Page 55 - 2019_09-HaematologicaMondo-web
P. 55
MAT mediates metabolic stress in HSPC
AB
CD
E
FG
H
N
IJKL M
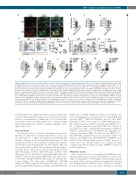
Figure 2. Adipocyte-derived stem cell factor (SCF) is a niche factor for hematopoietic stem and progenitor cells. (A) Co-staining of Perilipin and EGFP in the cMAT and rMAT of KitlEGFP mice. Scale bar=50 μm. (B and C) Levels of total Kitl mRNA (B) and SCF protein (C) in the flushed bone marrow (BM) from tibia of Kitlfl/fl (n = 5) and Adipoq-Cre+;Kitlfl/fl (n=6) 13-week old male mice. (D) BM cellularity in the femur of 13-week old Kitlfl/fl (n = 7) and Adipoq-Cre+;Kitlfl/fl (n=8) male mice. (E) Representative flow cytometry plots showing LSK and MP cells among the lineage– CD127– population in 13-week old Kitlfl/fl and Adipoq-Cre+;Kitlfl/fl male mice. Average frequencies are shown as inserts. (F) Quantification of absolute numbers of LSK and MP cells in the femur of 13-week old Kitlfl/fl (n=7) and Adipoq-Cre+;Kitlfl/fl (n=8) male mice and phenotypic LT-HSC in the femur of 8-month old Kitlfl/fl and Adipoq-Cre+;Kitlfl/fl (n=4) male mice. (G) Representative flow cytometry plots showing CMP, MEP, and GMP cells among the MP population in 13-week old Kitlfl/fl and Adipoq-Cre+;Kitlfl/fl male mice. Average frequencies are shown as inserts. (H) Absolute num- bers of CMP, MEP, and GMP cells in the femur of 13-week old Kitlfl/fl (n=7) and Adipoq-Cre+;Kitlfl/fl (n=8) male mice. (I) The ratio of marrow MEP to GMP in 13-week old Kitlfl/fl (n=7) and Adipoq-Cre+;Kitlfl/fl (n=7) male mice. (J) The absolute number of CLP in 13-week old Kitlfl/fl (n=7) and Adipoq-Cre+;Kitlfl/fl (n=7) male mice. (K) The ratio of marrow CMP to CLP in 13-week old Kitlfl/fl (n=7) and Adipoq-Cre+;Kitlfl/fl (n=7) male mice. (L) Colony formation assay of 2x10⁴ BM cells from Kitlfl/fl and Adipoq- Cre+;Kitlfl/fl (n=4) mice. (M) Spleen weight of Kitlfl/fl and Adipoq-Cre+;Kitlfl/fl (n=4) mice. (N) Colony formation assay of 2x10⁵ splenic cells from Kitlfl/fl and Adipoq-Cre+;Kitlfl/fl (n=4) mice. Data are presented as mean±Standard Deviation. *P<0.05; **P<0.01; ***P<0.001 by unpaired student t-test (B-K) or one-way ANOVA (N).
diluted in saline) were intraperitoneally (i.p.) injected when indi- cated. For thermoneutral housing, mice born at 22°C were trans- ferred to a room maintained continuously at 30°C at the age indi- cated. All procedures involving animals were conducted within Institutional Animal Care and Use Committee guidelines under approved protocols.
Flow cytometry
(BDBioscience, 740236). Multicolor analysis for progenitor and stem-cell quantification was performed on a 3-laser-LSRII flow cytometer (BD).12,39 HSPC was defined as Lin–Sca-1+c-Kit+ (LSK); phenotypic LT-HSC was defined as CD150+CD48–Lin–Sca–1+c- Kit+; myeloid progenitor (MP) was defined as Lin–CD127–Sca–1–c- Kit+; common lymphoid progenitor (CLP) was defined as Lin–CD127+Sca–1+c-Kit+; common myeloid progenitor (CMP) was defined as Lin–CD127-Sca–1–c-Kit+CD34+ FcγR–; megakaryocyte- erythrocyte progenitor (MEP) was defined as Lin–CD127–Sca–1–c- Kit+CD34–FcγR–; granulocyte-monocyte progenitor (GMP) was defined as Lin–CD127–Sca–1–c-Kit+CD34+FcγR+. SYTOXTM Green Dead Cell Stain (Thermo Fisher Scientific, S34860) was used to exclude dead cells. Absolute number was obtained by using counting beads (Thermo Fisher Scientific, C36950) as instructed by the manufacturer.
Bone marrow cells were isolated by flushing the femur in Ca2+
and Mg2+ free PBS with 1% heat-inactivated bovine serum. Cells
were dissociated to a single cell suspension by gently passing
through a 25-gauge needle and then filtering through a 70-mm
nylon mesh. Red blood cells from BM were removed by ammoni- um-chloride-potassium lysing buffer. For flow analyses, BM cells
were stained with a cocktail of biotin-conjugated lineage antibod-
ies CD3e, B220, Ter119, Mac-1 and Gr-1 (Biolegend, 133307),
CD4 (Biolegend, 100403), CD5 (Biolegend, 100603), CD8 Metabolicassays
(Biolegend, 100703), followed by Streptavidin-AF488 (Biolegend, 405235). Cells were then stained with CD127-APC (eBioscience, 17-1271-82), c-Kit-APC-eFluor780 (eBioscience, 47-1171-82), Sca- 1-Super Bright 436 (eBioscience, 62-5981-82), CD34-PE (Biolegend, 152204), and FcγR-PerCP-eFluor710 (eBioscience, 46- 0161-80), CD150-BV605 (Biolegend, 115927), and CD48-BUV395
Body composition was assessed using an EchoMRI system by which fat and lean mass measured by magnetic resonance scan- ning were normalized to body weight for fat percentage and lean percentage. Adipose tissue weight was determined by dissecting and weighing indicated adipose depots. For glucose tolerance tests, 16 h-fasted mice were injected i.p. with glucose (1.5 g/kg
haematologica | 2019; 104(9)
1733
