
Page 57 - 2019_09-HaematologicaMondo-web
P. 57
MAT mediates metabolic stress in HSPC
ABC
DE
FGH
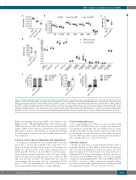
Figure 3. Impaired hematopoiesis when stem cell factor (SCF) is ablated in Osx1+ cells. (A) Bone marrow cellularity in the femur of 8-month old control (n=4), Osx1- Cre+;Kitlfl/+ (n=5), and Osx1-Cre+;Kitlfl/fl (n=4) male mice. (B) Frequencies of LSK, phenotypic LT-HSC, MP, CMP, GMP, MEP, and CLP populations in the bone marrow (BM) of 8-month old control (n=4), Osx1-Cre+;Kitlfl/+ (n=5), and Osx1-Cre+;Kitlfl/fl (n=4) male mice, determined by flow cytometry. (C and D) Ratios of MEP to GMP (C) and CMP to CLP (D) in 8-month old control and Osx1-Cre+;Kitlfl/fl (n=4) male mice. (E) Complete blood count of 10-week old control (n=8, including 6 Kitlfl/fl and 2 Osx1-Cre+) and Osx1-Cre+;Kitlfl/fl (n=7) male mice. (F) Colony formation assay of 2x10⁴ BM cells from Kitlfl/fl and Osx1-Cre+;Kitlfl/fl (n=4) mice. (G) Spleen weight of Kitlfl/fl and Osx1-Cre+;Kitlfl/fl (n=4) mice. (H) Colony formation assay of 2x10⁵ splenic cells from Kitlfl/fl and Osx1-Cre+;Kitlfl/fl (n=4) mice. Data are presented as mean±Standard Deviation. *P<0.05; **P<0.01; ***P<0.001 by one-way ANOVA followed with Tukey’s multiple comparison (A, B, and H) or unpaired Student t-test (C, E, and G).
ILIPIN (Cell Signaling Technology, 9349T, 1:1000 dilution), anti- PPARγ (CusAb, CSB-PA018424LA01HU, 1:500 dilution), anti- COX4 (Proteintech, 11242-1-AP, 1:1000 dilution), and anti-ACTIN (Sigma, A5441, 1:5000 dilution). Densitometry was performed using Image J. Relative band density was calculated by dividing the densitometry of target protein with loading control from the same membrane.
Isolation of bone marrow adipocytes and supernatant
A 0.6 mL microcentrifuge tube was cut open at the bottom and placed into a 1.5 mL microcentrifuge tube. Long bones were snipped both ends and placed in the prepared 0.6 mL microcen- trifuge tube. BM was flowed out by quick centrifuge (from 0 to 10,000 rpm, RT). Red blood cells from BM were lysed by ammo- nium-chloride-potassium lysing buffer. After 3,000 rpm centrifu- gation for 5 min at RT, floating adipocytes were collected as BM adipocytes from the top layer.40 The middle layer was collected and remaining cells were spun down by centrifugation (12,000 rpm, 30 s, RT). The supernatant was collected for SCF measure- ment using an ELISA (Thermo Fisher Scientific, EMKITL).
Colony-forming unit assay
The colony-forming unit (CFU) assay was performed using MethoCultTM GF M3434 (Stem cell) according to the manufactur- er’s instructions. Briefly, BM cells were flushed from one femur, and filtered through a 40 um cell strainer. Spleen was minced and pressed through a 40 um cell strainer to obtain single cell suspen- sion. 2x10⁴ BM cells or 2x10⁵ spleen cells were plated in methylcel- lulose, and the CFU were counted after 12 days.
Statistical analysis
All data are presented as mean±Standard Deviation (SD) or mean±Standard Error of Mean (SEM) as indicated in the figure leg- ends. The statistical significance between two groups was deter- mined by unpaired two-tailed Student t-test (Microsoft Excel or GraphPad Prism 7). Datasets involving more than two groups were assessed by one-way ANOVA with Tukey’s correction for multiple comparisons using GraphPad Prism 7. Two-way ANOVA followed by Tukey’s correction or Sidak’s correction for multiple compar- isons was performed using GraphPad Prism 7 to examine data with two independent variables. *P<0.05; **P<0.01; ***P<0.001.
haematologica | 2019; 104(9)
1735
