
Page 221 - 2019_09-HaematologicaMondo-web
P. 221
Tspan18 regulates Orai1 in endothelial cells
(Figure 6D and E). These data suggest that the impaired hemostasis phenotype is due to a defect in a non- hematopoietic vascular cell type such as the endothelial cell. This did not appear to be due to any observable structural defects in the vasculature, because immunohis- tochemistry analyses of blood vessels in organs such as kidney and pancreas were similar for wild-type and Tspan18-knockout mice (Figure 6F), as were immunoflu- orescence analyses of blood vessels in the ear (Figure 6G).
Tspan18 and Orai1 are required for endothelial release of von Willebrand factor in response to inflammatory mediators
Endothelial cell stimulation by inflammatory agonists induces vWF release from Weibel-Palade bodies via a process that involves Ca2+ signaling.14 To investigate whether Tspan18 could be required for vWF release, HUVEC were subjected to Tspan18 knockdown and stimulated in culture medium with thrombin or hista-
AC
DEF
G
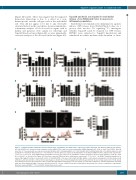
Figure 5. Orai1-knockdown endothelial cells have impaired Ca2+ mobilization and Orai1 surface expression requires Tspan18. (A-F) Human umbilical vein endothe- lial cells (HUVEC) were transfected with a negative control siRNA (CON) or with one of two independent siRNA targeting Orai1, Orai2 or Orai3 (Orai1-3 KD). After 48 hours (h), Ca2+ measurements were taken as described in Figure 2A-C, following addition of 1 U/mL thrombin (A), 20 μM histamine (B), or 10 μM ionomycin (C), and quantitation of maximum intracellular Ca2+ concentrations is shown. Error bars represent Standard Error of the Mean (SEM) from three independent experiments. **P<0.01; ***P<0.001. (D-F) siRNA-transfected HUVEC from (A-C) were subjected to quantitative real-time polymerase chain reaction (qPCR) for Orai1 (D), Orai2 (E) or Orai3 (F), as described for Figure 2D. Error bars represent SEM from three independent experiments. ***P<0.001. (G) HUVEC lentivirally-transduced to express Myc-tagged Orai1 were treated with control or Tspan18 siRNA. Cells were stained with anti-Myc (white) or anti-calnexin endoplasmic reticulum marker (red) antibodies, and representative confocal microscopy images are shown (top). In the line graphs below the images (bottom), the percentage expression of Orai1 (black) and calnexin (red) across the yellow line in the top panel was determined using ImageJ. The percentage of Orai1 that localized to a calnexin endoplasmic reticulum mask was then quantified (right). Data were generated from 15 cells per condition from three independent experiments (five cells per condition per experiment). Error bars represent SEM. ***P<0.001. RFU: relative fluorescence unit.
haematologica | 2019; 104(9)
1899
B
