
Page 193 - 2019_09-HaematologicaMondo-web
P. 193
Dysfunction and disintegration of platelets
AB
C
DEF
GH
I
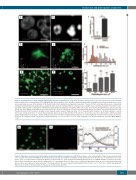
Figure 4. Rearrangement of actin during thrombin-induced platelet fragmentation. (A, B) Representative confocal microscopy z-stack projections of fixed isolated platelets stained for F-actin with Alexa Fluor 488-phalloidin before (A) and 60 min after (B) treatment with thrombin showing the intracellular redistribution of actin and a substantial increase in the intensity of the F-actin stain in the thrombin-treated platelets. Scale bars = 2 μm. (C) The F-actin-related fluorescence intensity in resting versus thrombin-treated platelets was quantified under identical staining conditions and microscope settings (mean ± standard deviation, n=3). (D, E) F-actin- based three-dimensional reconstruction of thrombin-activated platelets in platelet-rich plasma (PRP) clots before (D) and after (E) fragmentation captured at 5 min and 60 min after addition of thrombin, respectively. Scale bars = 2 μm. (F) Histogram of F-actin-containing cellular particles of various size in untreated (n=107) and thrombin-treated (n=107) platelets, showing a shift towards smaller platelet fragments after 1 h of incubation with thrombin. (G, H) Representative confocal microscopy z-stack projections of calcein-labeled platelets (green) treated with thrombin in the absence (G) and presence (H) of latrunculin A, which prevented platelet fragmentation. Scale bars = 10 μm. (I) Mean fluorescence intensity of individual whole platelets or cellular fragments stained for F-actin (total 107 particles analyzed) as a function of their size (mean ± standard deviation). ***P<0.001 and ****P<0.0001 compared to the untreated platelets, two-tailed Mann-Whitney U test.
AB
C
Figure 5. Time-lapse measurement of intracellular calcium in thrombin-treated platelets. (A, B) Representative confocal micrographs of platelets pre-incubated with a Ca2+-sensitive fluorophore Fluo-4AM at 15 min (A) and 120 min (B) after addition of thrombin to platelet-rich plasma in the presence of extracellular Ca2+. Scale bars = 4 μm. (C) Confocal microscopy-based dynamics of intracellular Ca2+ levels in thrombin-activated platelets (mean ± standard deviation, n=3) in the presence (black circles) and absence (open circles) of extracellular Ca2+ superimposed over the time course of platelet fragmentation in the presence (blue dashed line) and absence (blue open squares) of extracellular Ca2+. The arrow indicates the onset of platelet disintegration in the presence of Ca2+. There were statistically significant differences (P<0.05) for 30 min versus 60 min and for 60 min versus 120 min.
haematologica | 2019; 104(9)
1871
