
Page 195 - 2019_09-HaematologicaMondo-web
P. 195
Dysfunction and disintegration of platelets
ABCD
EF
GH
IJ
KLM
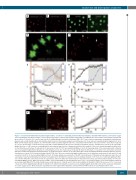
Figure 6. Concurrent thrombin-induced platelet fragmentation, cessation of contractility, mitochondrial depolarization, metabolic ATP depletion, and reactive oxygen species production. (A-D) Representative confocal microscopy images of platelet mitochondria stained with a red MitoTracker (A, B) and the same platelets marked with green calcein (C, D) before (A, C) and 90 min after (B, D) adding thrombin to platelet-rich plasma (PRP). (E, F) Confocal microscopy images showing both activated green platelets and red mitochondria (E) or mitochondria only (F) located at the platelet periphery and in filopodia (1, 2, 5) as well as in separated platelet fragments (3, 4, 6). White arrows indicate typical examples of a mitochondrion inside a platelet fragment and a free extracellular mitochondrion. Scale bars in (A-D) = 5 μm, those in (E) and (F) = 3 μm. (G) Time-lapse confocal microscopy of the DΨm-sensitive MitoTracker fluorescence intensity (red symbols) (mean ± standard error of mean, n=4), reflecting a gradual decrease of DΨm inversely correlating with the increasing average fraction of fragmented platelets (blue symbols). There were statistically significant differences for the initial time point versus 30 min and for 30 min versus 90 min (P<0.05, two-tailed Mann-Whitney U test). (H) Superimposition of the platelet-generated contractile stress over platelet fragmentation dynamics in contracting blood clots. The shaded areas in (G) and (H) show the time-frame of cessation of clot contraction concurrent with mitochondrial depolarization and fragmentation. (I) Gradual metabolic reduction of the intracellular ATP content in individual thrombin-stimulated platelets (mean ± standard error of mean, 50-100 platelets analyzed from 3 PRP clots). There were statistically significant differences for the initial time point versus 30 min and for 30 min versus 120 min (P<0.05, two-tailed Mann-Whitney U test). (J) Parallel dynamic measurements of the ATP content in lysates of thrombin-activated platelets and in the acti- vated platelet supernatant following clot formation normalized by the thrombin-free baseline (mean ± standard deviation, n=3). There were statistically significant differ- ences for the initial time point versus 30 min for supernatant, and for the initial time point versus 30 min and 30 min versus 120 min for platelet lysates (P<0.05, two- tailed Mann-Whitney U test). Whole blood (G, H) or PRP (I, J) was activated with 1 U/mL thrombin and CaCl2 at 37°C. (K, L) Representative confocal micrographs of platelets pre-incubated with MitoSOXTM Red (mitochondrial super oxide indicator) at 3 min (K) and 60 min (L) after addition of thrombin to PRP in the presence of Ca2+. Scale bars = 4 μm. (See Online Supplementary Movies S3 and S4 for the full 120 min long time sequences at low and high magnifications) (M) Confocal microscopy-based dynamics of reactive oxygen species (ROS) production superimposed on the fragmentation dynamics, both determined in PRP clots (mean ± standard deviation, n=3).
haematologica | 2019; 104(9)
1873
