
Page 191 - 2019_09-HaematologicaMondo-web
P. 191
Dysfunction and disintegration of platelets
(Figure 4B,D and Online Supplementary Figure S3B). F-actin was detected in platelet fragments but the fluorescence intensity was non-uniform (Figure 4E and Online Supplementary Figure S3C).
Inhibition of actin polymerization by latrunculin A or cytochalasin D before activation with thrombin prevented platelet fragmentation, as revealed by both confocal microscopy of platelets in plasma clots (Figure 4G,H) and transmission electron microscopy of isolated platelets (Online Supplementary Figure S4A-E). Remarkably, latrun- culin A in combination with thrombin caused significant enlargement of the open canalicular system, associated with formation of large vacuoles as well as platelet degranulation, but without disintegration of platelets (Figure 4H and Online Supplementary Figure S4C,D). Pre- treatment of platelets with paclitaxel, which inhibits depolymerization of microtubules, also prevented throm-
A
bin-induced platelet disintegration (not shown), indicating involvement of the plasma membrane cytoskeleton built ofmicrotubules.
Condensation of F-actin in thrombin-stimulated platelets and its extinction during fragmentation
In order to quantify changes in the intracellular concen- tration or compactness of actin, the intensity of the F-actin stain was compared in untreated and thrombin-treated cells, using confocal microscopy at identical microscope settings. Thrombin caused an ~300-fold increase in the overall intracellular F-actin intensity (Figure 4C), which was accompanied by a reduction in the size of individual platelets. The X-Y cross-sectional area of resting platelets was between 3 and 12 μm2 with a median of 7.5 μm2, while in the vast majority of thrombin-treated platelets, the cross-sectional area was less than 5 μm2 with a median
B
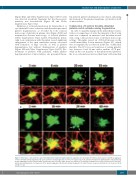
Figure 2. Time-lapse confocal microscopy of thrombin-induced platelet fragmentation in a plasma clot. (A) A single thrombin-activated platelet and (B) an aggregate of three thrombin-activated platelets fall apart and form cellular fragments over time. The upper rows in (A) and (B) show platelets without fibrin. Subcellular frag- ments originating from the filopodia (white arrowheads) and cell bodies (white arrows) are indicated. The dashed rectangular area in (B) at 24 min and 60 min time- points show disintegration of a larger part of the platelet aggregate (24 min) into smaller fragments (60 min). Platelets are green and fibrin is red. Scale bars in (A) and (B) = 3 μm.
haematologica | 2019; 104(9)
1869
