
Page 192 - 2019_09-HaematologicaMondo-web
P. 192
O.V. Kim et al.
A
B
CD
E
FG
HI
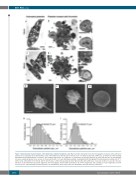
Figure 3. Ultrastructural characterization of thrombin-induced platelet fragments. (A-D) Representative transmission electron micrographs of isolated control untreated platelets (A, C) and platelets incubated with 1 U/mL of thrombin for 15 min (B) and 60 min (D) at 37°C in Tyrode buffer with 2 mM CaCl2. (1-4) Particles formed during thrombin-induced fragmentation of a platelet. The designated structures are a-granules (a), δ-granules (δ), glycogen granules (g), lysosomal vacuoles (l), mitochondria (m), open canalicular system (ocs), vacuole (v). Scale bars in (A-D) = 0.5 μm. (E-G) Representative scanning electron micrographs of isolated platelets incubated at 37°C with 1 U/mL of thrombin for 15 min (E) and 60 min (F) and a control untreated platelet (G) in Tyrode buffer with 2 mM CaCl2. Scale bars in (E-G) = 1 μm. (H, I) Size dis- tributions of thrombin-induced platelet fragments from micrographs obtained with transmission (H, n=400 fragments) and scanning (I, n=210 fragments) electron microscopy. The experimentally determined particle size distributions (bars) in (H) and (I) are fitted with a Gaussian function (solid lines).
1870
haematologica | 2019; 104(9)
