
Page 190 - 2019_09-HaematologicaMondo-web
P. 190
O.V. Kim et al.
nm according to both the transmission and scanning elec- tron micrographs (Figure 3H,I). Importantly, platelets treat- ed with soluble collagen or ADP maintained their integrity during 2 h of incubation, although they did show morpho- logical signs of activation (Online Supplementary Figure S2).
Cytoskeletal rearrangements associated with thrombin-induced platelet fragmentation
To see whether fragmentation of thrombin-activated platelets involves rearrangement of actin cytoskeleton, we
used fluorescent confocal microscopy to follow the dynamics of rhodamine-labeled F-actin in resting platelets and thrombin-treated platelets for 1 h. In most resting platelets, F-actin was detected throughout the area of a cell section and was distributed evenly rather than form- ing patches (Figure 4A and Online Supplementary Figure S3A). In some resting platelets, F-actin was preferentially distributed along the cell periphery. By contrast, in throm- bin-activated platelets F-actin was typically detected as intense fluorescent clusters shifted toward the cell center
AB
CD
EFG
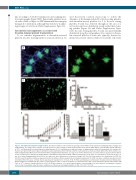
Figure 1. Thrombin-induced platelet fragmentation. (A-C) Representative confocal microscopy images of thrombin-activated platelets undergoing shape changes and fragmentation. The images were acquired 1 h (A, B) and 3 h (C) after clotting of citrated human platelet-rich plasma (PRP) with 1 U/mL thrombin and 31 mM CaCl2 at 37°C. (A) Fibrin-attached activated platelets with filopodia (1, 2, 5) and platelets at different stages of fragmentation: initial (4), intermediate (3), and final (6). Platelets are labeled with calcein (green) and fibrin is labeled with Alexa Fluor-647 (blue). (B) The same platelets as in (A) are shown without the fibrin channel. (see Online Supplementary Movie S1 for the thrombin-induced fragmentation dynamics at a large scale in three dimensions). (C) Confocal microscopy-based three-dimen- sional reconstruction of widespread fragmentation of thrombin-treated platelets within a PRP clot prepared as in (A) after 3 h of incubation. Scale bars in (A-C) = 3 μm. (See Online Supplementary Movie S2 for the large-scale three-dimensional reconstructed image). (D) The subcellular particle size distribution in a PRP clot (n=180, bars) fitted with a multi-peak Gaussian function (solid line). (E) Increasing fraction of fragmented platelets in a PRP clot under conditions described in (A-C) determined from time-lapse confocal microscopy (mean ± standard error of mean, n=4). (F) Flow cytometry-based enumeration of platelet-derived CD41-positive platelet fragments normalized by the number of gated platelets after 60 min of incubation of isolated platelets with 1 U/mL thrombin in Tyrode buffer with 2 mM CaCl2 at 37°C (mean ± standard deviation, n=10). (G) Relative numbers of the platelet-gated signals (corresponding to the intact platelets remaining in a sample) after 60 min of incubation under the same conditions as in (E) (mean ± standard deviation, n=12). *P<0.05, **P<0.01.
1868
haematologica | 2019; 104(9)
