
Page 117 - 2019_09-HaematologicaMondo-web
P. 117
UBE2A somatic variants in CML progression
A
B
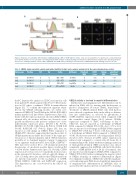
Figure 4. Induction of neutrophilic differentiation in UBE2A wild-type (WT) or I33M 32Dcl3 cell line. Cells were treated with IL-3 or granulocyte-colony stimulating factor (GCSF). (A) Fluorescence-activated cell sorting analysis (FACS) analysis of CD11b staining after induction of differentiation at days 3 and 6. (B) CD11b immuno- fluorescence staining for 32Dcl3 control (CTRL), UBE2A WT and I33M at day 6 showing a clear reduction in UBE2A I33M CD11b staining (scale bar: 20 μm).
Table 2. UBE2A single nucleotide variants and indels identified in blast crisis samples and absent in the paired chronic phase control.
Chromosome Position
chrX 119574955
chrX 119583137
chrX 119583136
chrX 119574957
Ref Var
A G
A T G T
Ins AT
Codon
ATA->ATG
GAT->GTT
GAT->TAT ATG->ATATG
AA Change Polyphen2 DANN Fathmm HDIV Score MKL
Ile33Met D 0.992 N
phastCons7 Vertebrate
0.999
Chr: Ref: reference;Var: variant; n.a.: not available.
Asp114Val D 0.993 D 1 Asp114Tyr D 0.996 D 1
M34fs n.a. n.a. n.a. n.a.
UBE2A activity is involved in myeloid differentiation
Erythrocytes and megakaryocyte differentiation can be induced in K562 cells by treating with hydroxyurea or phorbol 12-myristate 13-acetate (PMA), respectively.23,24 Treatment of UBE2A-silenced K562 cells with hydrox- yurea showed a significant delay in the ability to differen- tiate into erythrocytes, as assessed by glycophorin A (GYPA-CD235a) expression levels when compared with the scrambled control (Figure 3A-C) (relative CD235a expression compared to shNC fold-change at day 0: 0.54±0.13, data are reported as fold-change in UBE2A I33M compared to UBE2A WT<0.001; day 1: 0.70 ± 0.12, data are reported as fold-change in UBE2A I33M compared to UBE2A WT <0.05; day 3: 0.61 ± 0.15, data are reported as fold-change in UBE2A I33M compared to UBE2A WT <0.05). Fluorescence-activated cell sorting analysis (FACS) showed a 45% decrease in GYPA surface expression in silenced cells compared to controls after 24 hours (h) of treatment (Figure 3B). In line with these findings, induction of hemoglobin-subunit-β (HBB) production was almost completely suppressed in shUBE2A cells [6.6-fold relative decrease of HBB mRNA level at 24 (h) of treatment: data are reported as fold-change in UBE2A I33M compared to UBE2A WT<0.001] further confirming the negative effect of UBE2A silencing on erythroid differentiation (Figure 3C). Similarly, treatment of K562 cells with the megakary- ocytic-inducing agent PMA showed significant impairment of megakaryocyte differentiation in shUBE2A cells, as assessed by the expression levels of CD41 (33% downreg-
the BC. Immunoblot analysis on CP/BC mononuclear cells from patient #3, which acquired the D114V-UBE2A muta- tion in BC phase, confirmed CSF3R downmodulation (Figure 2G). To confirm the expression signature identi- fied in the UBE2A silencing models, we stably over- expressed UBE2A WT and I33M in the 32Dcl3-BCR/ABL1 murine myeloid cell line (Online Supplementary Figure S4). In line with the expression profile shown in K562 UBE2A silenced cells, also in these cell lines we observed a com- parable modulation in the previous analyzed set of five differentially expressed genes (ITGB4 1.52 P<0.01, RDH10 1.30 P<0.05, CLEC11A 2.84 P<0.01, CSF3R 0.25 P<0.05, RAP1GAP 0.27 P<0.01) (Figure 2H; data are reported as fold-change in UBE2A I33M compared to UBE2A WT), therefore supporting the hypotheses that: 1) UBE2A mutations modulate the activity of the target pro- tein in a loss of function manner; and 2) UBE2A mutations probably act as dominant negative variants. Comparison of our signature with known BC data (GEO _GSE47927 - HSC data were used for BC vs. CP calculation) indicated the presence of a moderate positive linear correlation (R2 = 0.234) (Online Supplementary Figure S5). Notably, CSF3R expression level was seen to be markedly decreased also in the reference BC database, with a Log2 fold-change of -2.19. Globally, these data indicate that UBE2A mutations are directly responsible for the modulation of CSF3R, ITGB4, RDH10, CLEC11A and RAP1GAP expression. This hypothesis is also corroborated by the 32Dcl3 cell models.
haematologica | 2019; 104(9)
1795
