
Page 116 - 2019_09-HaematologicaMondo-web
P. 116
V. Magistroni et al.
AB
CD
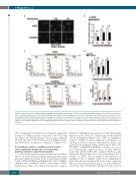
Figure 3. Induction of erythroid differentiation in UBE2A-silenced K562 cell line. K562 cells were treated with 400 μM hydroxyurea. (A) CD235a immunofluores- cence staining for UBE2A-silenced K562 (shUBE2A) and control (shNC) cells after hydroxyurea or mock (-) treatments for the indicated times. (scale bar: 25 μm). (B) Average intensity of CD235a signal obtained acquiring ten fields from two independent experiments for each sample (approx. 80 cells each). (C) Fluorescence- activated cell sorting analysis (FACS) analysis of CD235a levels in K562 cells in presence (red line) or absence (black line) of hydroxyurea. (D) Quantification of CD235a and hemoglobin mRNA relative levels (HBB: Hemoglobin-subunit-β) through real-time quantitative polymerase chain reaction (RT-qPCR) after hydroxyurea treatment.
ATP consumption, and therefore in ubiquitin-conjugating activity, for UBE2A mutants compared to the WT form [see Figure 1E: enzyme specific activity assay, 1.55-fold (P<0.01) and 1.53-fold (P<0.01) decrease in UBE2A D114V and I33M AMP concentration compared to UBE2A WT].
Transcriptome analysis of UBE2A cellular models shows significant perturbation of downstream pathways related to myeloid development
To identify the gene networks perturbed by the UBE2A knock-out, stable lentiviral UBE2A silencing models were generated (Figure 2A and B) in the human myeloid K562 cell line (K562-shUBE2A and K562-shNC cells for UBE2A silencing and scrambled control, respectively) (Online Supplementary Figure S2). Whole-transcriptome analysis
(RNA-Seq) highlighted the presence of 168 differentially expressed genes, with 117 of them being down-regulated and 51 up-regulated (Figure 2C). Gene set enrichment analysis (GSEA) showed significant enrichment for ontologies related to myeloid differentiation (Figure 2D) and neural development (Online Supplementary Figure S3). RT-qPCR on K562shNC/shUBE2A cell lines on a set of five differentially expressed genes (ITGB4, RDH10, CLEC11A, CSF3R, RAP1GAP) confirmed RNA-Seq data (Figure 2E). Interestingly, the colony stimulating factor 3 receptor (CSF3R) was potently down-regulated in shUBE2A both at mRNA (12.5-fold downregulation; Figure 2E) and protein (Figure 2F) levels, hence suggesting that its downmodulation may play a role in the differenti- ation block that is ultimately responsible for the onset of
1794
haematologica | 2019; 104(9)
