
Page 58 - 2019_08-Haematologica-web
P. 58
A.E. Armitage et al.
(encoding transferrin receptor 1, TfR1), which abrogated lymphocyte iron acquisition, was the cause of fatal com- bined immunodeficiency due to an inability to protect against infections.40 Thus, it is conceivable that low plas- ma iron availability may similarly impair adaptive immu- nity. The longitudinal analyses paradoxically suggested that changes in plasma iron inversely predicted changes in hepcidin; the reason for this is unclear, but could be driven by events in the first two months, when serum iron and hepcidin appear to differ most in their kinetics.
Soluble transferrin receptor is frequently used as a bio- marker of tissue iron demand, and is typically associated with erythropoiesis.41 Concentrations of sTfR fell between birth and two months of age in both cohorts, presumably reflecting low erythropoietic demand at this point conse- quent upon the decline of the high birth hemoglobin con- centration and recycling of its iron; however, sTfR concen- trations were raised by 12 months of age, especially in males. By this time, elevated sTfR strongly associated with suppressed hepcidin, and fixed effects modeling, demonstrated how increases in sTfR within an infant over time predicted hepcidin reduction (overcoming the hep- cidin-stimulatory effect of inflammation). Erythropoietic drive can suppress liver hepcidin production through activity of the recently characterized erythroblast-derived
hormone erythroferrone, liberating iron to meet erythro- poietic demands. 18Erythroferrone assays were not avail- able at the time of this analysis, but it will be important to investigate its role during infancy, especially in LMIC set- tings. In addition, our cross-sectional and longitudinal analyses both also revealed weight gain to be strongly associated with declining hepcidin during infancy. Tissue accretion and erythropoietic expansion are widely acknowledged as consumers of iron in infancy, yet vari- ability in growth rate within and between infants is less frequently considered to be a risk factor for earlier onset of iron depletion and deficiency in infancy than other risk factors (such as premature birth, early cord clamping, low birthweight or early consumption of cow’s milk).6,9 In uni- variable analysis, lower birthweight did correlate as expected with reduced hepcidin at five months in both cohorts, yet there was more consistent evidence of a rela- tionship between antecedent growth and hepcidin (noting that there was no such relationship of hepcidin or ferritin with subsequent weight gain); moreover, in multivariate cross-sectional models, prior weight gain remained signif- icantly inversely associated with hepcidin, irrespective of birthweight. Our longitudinal fixed effects models added strength to these observations, with more rapid weight gain predicting a more profound decline in hepcidin over
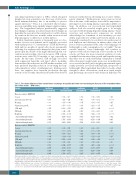
Table 5. The relative influence of time-variant factors on changes in hepcidin and ferritin over time during the first year of life in Gambian infants: fixed effect models – VPM cohort.
Variable
Outcome variable: HEPCIDIN Season
Infection in last 4 weeks Weaning
Plasma iron, μmol/L sTfR, mg/L CRP,mg/L
Weight, kg
lower birthweight females lower birthweight males higher birthweight males
Outcome variable: FERRITIN
Season
Infection in last 4 weeks Weaning
Plasma iron, μmol/L sTfR, mg/L
CRP,mg/L
Weight, kg
lower birthweight females lower birthweight males higher birthweight males
Coefficient (unstandardized)
0.106 0.207 -0.060 -0.080 -0.974 0.105 -1.402 -0.281 -1.064 -0.313
0.104 0.085 -0.438 -0.048 -1.176 0.069 -1.760 -0.099 -0.626
-0.966
95% CI (unstandardized)
0.013 – 0.200 0.119 – 0.294 -0.165 – 0.046 -0.150 – -0.010 -1.206 – -0.741 0.042 – 0.168 -1.786 – -1.018 -0.687 – 0.125 -1.781 – -0.348 -0.628 – 0.002
0.033 – 0.176 -0.000 – 0.171 -0.586 – -0.291 -0.124 – 0.028 -1.439 – -0.914 0.017 – 0.120 -2.144 – -1.377 -0.559 – 0.361 -1.080 – -0.172
-1.560 – -0.371
Coefficient (standardized)
0.092 0.141 -0.047 -0.108 -0.328 0.145 -0.411 -0.083 -0.312 -0.092
0.065
0.042
-0.251
-0.047
-0.286
0.068
-0.374
-0.021
-0.133
-0.205
95% CI (standardized)
0.011 – 0.172 0.081 – 0.202 -0.131 – 0.037 -0.202 – -0.015 -0.407 – -0.248 0.059 – 0.231 -0.522 – -0.301 -0.202 – 0.037 -0.520 – -0.104 -0.184 – 0.000
0.020 – 0.110
-0.000 – 0.085
-0.337 – -0.166
-0.121 – 0.028
-0.349 – -0.223
0.017 – 0.120
-0.455 – -0.293
-0.119 – 0.077
-0.229 – -0.037
-0.331 – -0.079
P
0.026 <0.001 0.265 0.025 <0.001 0.001 <0.001 0.172 0.005 0.052
0.005
0.050
<0.001
0.215
<0.001
0.010
<0.001
0.672
0.007
0.002
Data represent the pooled analysis of 100 datasets in which any missing data were imputed by multiple imputation, combined using Rubin’s combination rules, as described in detail in Online Supplementary Methods. Unstandardized coefficients indicate the effect of a unit change over time of an explanatory variable on changes over time within a child in the outcome variables hepcidin and ferritin,which were handled using seemingly unrelated regression to account for strong correlations between outcome variables. Standardized coefficients indicate the effect of a change of one standard deviation of an explanatory variable over time on standard deviation of outcome variables over time within a child. Infection was coded as “no infection=0” and “occurrence of infection=1”; Season was coded as “dry season (November-June)=0” and “wet season (July- October)=1”; Sex was coded as “female=0” and “male=1”. Interactions of weight change with birthweight group (groups indicated in italics: above or below WHO weight-for-age z-score of -0.5) and sex were modeled with coefficients/P-values representing differences for weight change relative to higher birthweight females as reference group.
1550
haematologica | 2019; 104(8)
